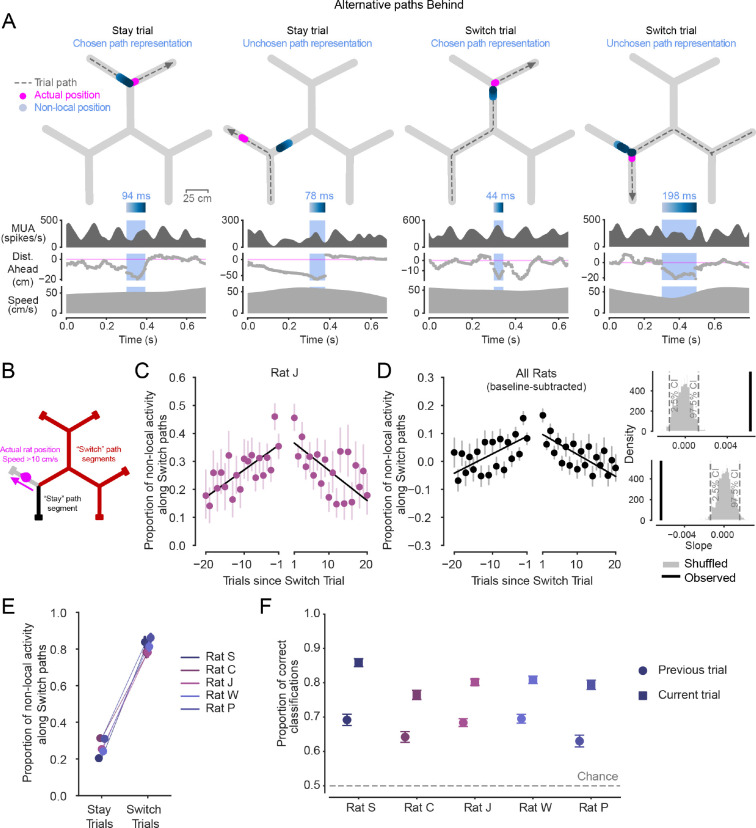
Figure 3. Non-local representations of alternative paths Behind are also enriched across trials before and after patch Switching.
(A) Examples of non-local representations of paths behind in Stay and Switch trials. Top: Animal’s actual position (magenta) and decoded position from hippocampal spiking (blue, shaded by time) during the blue-highlighted period (below) are plotted on the track. Dashed grey line with arrow indicates animal’s path and direction on the current trial. Highlighted non-local duration is labeled above blue time-shaded heatmap. Top-middle: multiunit spike rate from hippocampal tetrodes before, during, and after highlighted non-local representation. Bottom-middle: Distance from actual position to decoded position, with positive values corresponding to in front of the animal’s heading, and negative numbers corresponding to behind the animal’s heading. Bottom: Animal speed. Note that periods outside the blue shaded region where the distance behind is large (e.g., second example) correspond to representations that are in the same track segment as the animal at that time rather than an alternative non-local segment.
(B) Schematic defining Stay and Switch non-local activity behind, analyzed in C-F.
(C) Proportion of all non-local activity that represents paths consistent with Switching during the approach of the reward port across Stay trials preceding and following Switch trials in one rat. Left and right x axes separated to reflect patch change. Error bars are 95% CIs on the mean. Linear regression lines show increasing and decreasing proportions before and after patch Switch trials occur. Individual data for all rats shown in Fig. S2B.
(D) Left: Proportion of all non-local activity that represents paths consistent with Switching during the approach of the reward port across all animals (n=5 rats), normalized per animal by subtracting off the average baseline proportion on Stay trials. Error bars are 95% CIs on the mean. Pre- and post-Switch linear regressions overlaid. Upper right: observed slope of pre-Switch regression (black) is significantly different from 0 (p<0.002) based on 1000 shuffles of the underlying data (grey). Lower right: observed slope of post-Switch regression (black) is significantly different from 0 (p<0.002) based on 1000 shuffles of the underlying data (grey). Both slopes were individually significant in all five animals (Fig. S2B).
(E) Proportion of all non-local activity that represents paths consistent with Switching during the approach of the reward port in each animal on Stay trials and Switch trials. Error bars are 95% CIs on the mean. Switch trial distributions are significantly greater than in Stay trials for all animals (p=5.6e-264, 1.1e-155, 3.2e-300, 1.0e-100, 1.1e-277, Wilcoxon rank sum test, for n=292, 344, 525, 424, 443 Switch trials and n=3079, 3660, 6582, 4924, 3001 Stay trials).
(F) Accuracy of logistic regressions predicting Stay or Switch choices based on proportion of all non-local activity that represents paths consistent with Switching during the approach of the reward port. Neural data from two trial types: previous trial (circle marker), or current trial (square marker). Error bars are 95% CIs on the proportion. Training data were balanced, so chance level was 0.5. Accuracy of model using previous trial neural data is significantly greater than chance in all animals (p=2.4e-58, 7.1e-32, 1.2e-56, 1.3e-40, 3.1e-48, Z test for proportions), and current trial model accuracy is greater than previous trial model accuracy (p=2.4e-58, 7.1e-32, 1.2e-56, 1.3e-40, 3.1e-48 ).

