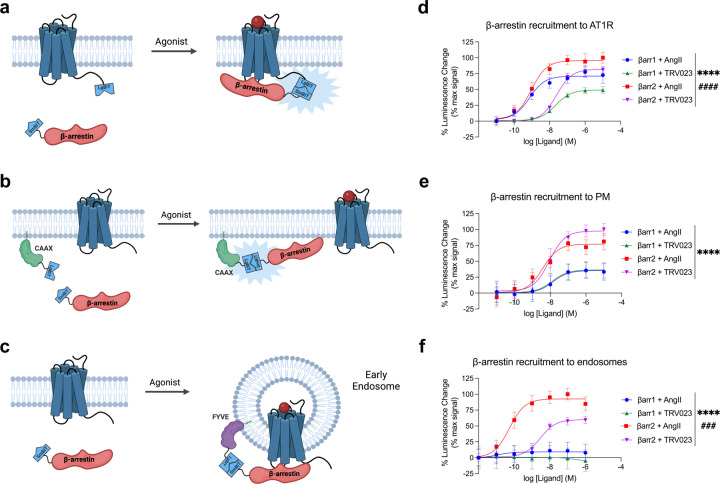
Figure 1: AngII and TRV023 promote different trafficking patterns of β-arrestins 1 and 2.
(a-c) Schematics of NanoBiT assay monitoring the trafficking of β-arrestin 1 or β-arrestin 2 to the AT1R, PM, and early endosomes. (d-f) Dose response curves of the trafficking of β-arrestin isoforms to the AT1R (d), PM (e), and early endosomes (f). HEK293T cells were stimulated with agonist at the concentrations listed. Data is shown as percent change over vehicle normalized to max signal. Data represents mean ± SEM of n independent biological replicates, n=3 for AT1R and endosomes, n=5 for PM. One-way ANOVA with Tukey’s multiple comparison test to compare the Emax and EC50 values. * denotes the statistically significant differences between the Emax values. # denotes the statistically significant differences between the EC50 values. ****P<0.0001; ###P<0.0005; ####P<0.0001.

