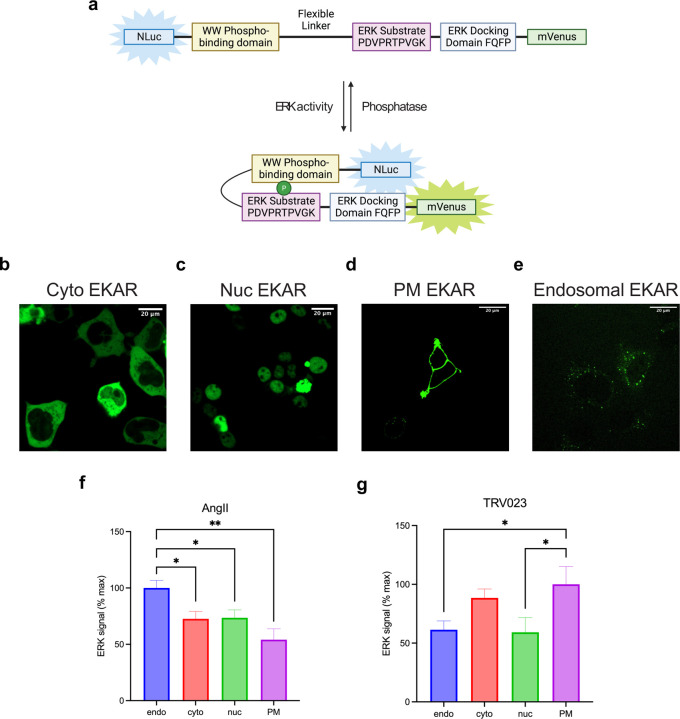
Extended Data Figure 6: EKAR BRET biosensors to assess location-specific ERK1/2 activation in HEK293T cells.
(a) Schematic of BRET-based EKAR biosensors adapted from the previously published FRET versions58 (b-e) Confocal microscopy images of EKAR biosensor expression in the cytosol, nucleus, PM, and early endosomes. (f-g) Distinct distribution of subcellular pools of ERK signaling promoted by AngII and TRV023. Data was quantified as AUC of BRET signals over 50 minutes after ligand stimulation and normalized to the max signal of each ligand. Data represents mean ± SEM of n independent biological replicates, n=4 for PM and cytosolic ERK, n=5 for nuclear and endosomal ERK. One-way ANOVA with Holm-Šídák’s posthoc test comparing to subcellular location with max signal. *P<0.05; **P<0.005.

