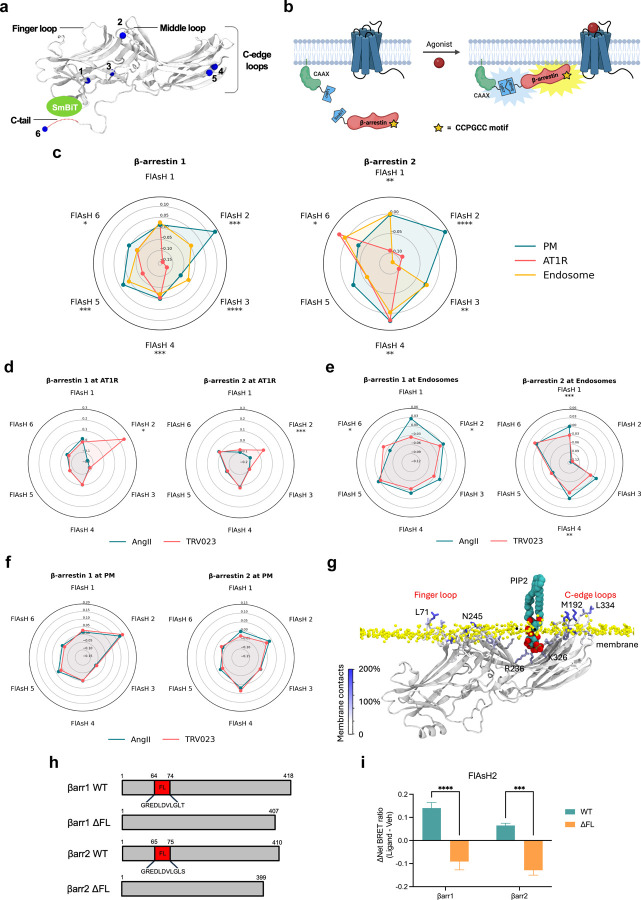
Figure 2: AT1R agonists promote distinct conformations of β-arrestins 1 and 2 at the receptor and endosomes but not the plasma membrane.
(a) Schematic of NanoBiT FLAsH conformational biosensors. The tetracysteine motif CCPGCC (blue) is inserted after amino acid G39, K138, K170, N223, T261 and G409 for SmBiT-β-arrestin 1 or G40, K139, K171, N225, T263 and G410 for SmBiT-β-arrestin 2 to generate FlAsH 1–6, respectively. (b) Diagram of the NanoBiT FlAsH assay to detect the conformations of β-arrestins 1 and 2 at the receptor, the PM, or early endosomes. (c) Radar plots of the BRET signals from six FlAsH probes represent the location-specific conformations of β-arrestin 1 and β-arrestin 2 following stimulation with 1 μM AngII at the AT1R, PM or endosomes. Data represents mean ± SEM of n independent biological replicates. For AT1R, FlAsH 1: n=3, FlAsH 2,4: n=4, FlAsH 3, 5, 6: n=5. For CAAX, FlAsH 1–4: n=4, FlAsH 5: n=5, FlAsH 6: n=6. For 2xFYVE, FlAsH 1–5: n=4, FlAsH 6: n=3. One-way ANOVA with Tukey’s post hoc test comparing different subcellular locations for a specific FlAsH probe. *P<0.05; **P<0.005; ***P<0.0005; ****P<0.0001. (d, e, f) Radar plots comparing the ligand-specific effects on the conformational profiles of β-arrestins 1 and 2 in different subcellular locations. Cells were stimulated with 1 μM AngII or 10 μM TRV023. Data represents mean ± SEM of n independent biological replicates. Data with TRV023 has the same number of replicates as AngII, except FlAsH 5 (CAAX): n=7 and FlAsH 2 (FYVE): n=5. Unpaired two-tailed t-tests comparing AngII vs. TRV023 for each FlAsH sensor. *P<0.05; **P<0.005; ***P<0.0005; ****P<0.0001. (g) MD simulations of membrane-bound β-arrestin 1 anchored to the lipid bilayer with the finger loop, C-loop, and C-edge loops (3 × 500 ns). Residues have been colored according to the stability of contacts formed with the membrane (the frequency of contacts of each residue with individual membrane components has been calculated and summed in a per-residue fashion; residues with higher values form more stable interactions with the membrane). The position of PIP2 is also highlighted. (h) Diagram of WT β-arrestin 1, WT β-arrestin 2, and their finger loop deletion mutants. The position of the finger loop is highlighted in red. (i) Changes in FlAsH 2 signal of PM-localized β-arrestin 1 and β-arrestin 2 with deletion of the finger loop region. Data represents mean ± SEM, n=4 independent biological replicates. Two-way ANOVA with Šídák’s multiple comparisons comparing WT vs. ΔFL mutants. ***P<0.0005; ****P<0.0001.

