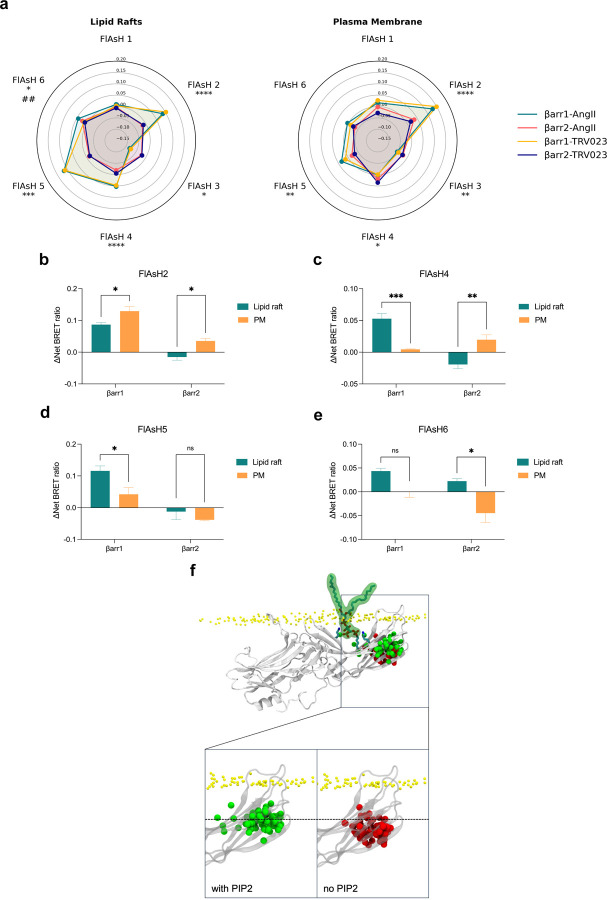
Figure 3: β-arrestin conformations are dependent on the lipid environment of the plasma membrane.
(a) Radar plots from NanoBiT FlAsH assay demonstrate distinct conformations of β-arrestins 1 and 2 in non-raft membrane and lipid rafts after 2–10 min stimulation of AT1R with 1 μM AngII or 10 μM TRV023. No statistically significant agonist effect was observed in β-arrestin 1 and 2 conformations. Two-way ANOVA with Tukey’s multiple comparison test. * denotes the statistically significant differences between the β-arrestin isoforms. # denotes the statistically significant differences between the AT1R agonists. *P<0.05; **P<0.005; ***P<0.0005; ****P<0.0001; ##P<0.005. (b-e) Comparison of the BRET signals of FlAsH 2, FlAsH 4, FlAsH 5, and FlAsH 6 of β-arrestins 1 and 2 at lipid rafts and PM. Cells were stimulated with AngII. Data represents mean ± SEM, n=3 independent biological replicates for lipid rafts, n values for PM similar to figure 2. Two-way ANOVA with Šídák’s multiple comparison test to compare between PM vs lipid raft for each isoform. *P<0.05; **P<0.005; ***P<0.0005; ns, not significant. (f) MD simulations of β-arrestin 1 anchored to the PM (3 × 500ns) with (green) and without (red) PIP2. The simulation was aligned using membrane atoms. The position of the Cα atom of N223 (FlAsH 4) during the last half of each replicate is depicted in 10 ns intervals.

