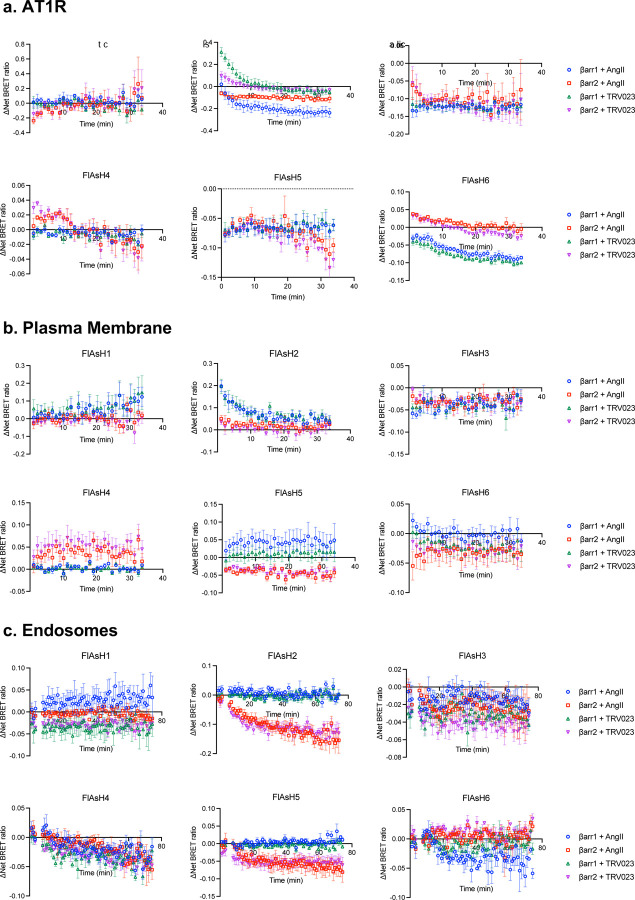
Extended Data Figure 3: Kinetic tracings of BRET signals from NanoBiT FlAsH assays to detect location-specific β-arrestin conformations.
(a) For β-arrestin conformations at AT1R, HEK293T cells were transfected with AT1R-LgBiT and one of the six SmBiT-β-arrestin1-FlAsH biosensors or six SmBiT-β-arrestin2-FlAsH biosensors. (b) For β-arrestin conformations at the PM, HEK293T cells were transfected with FLAG-AT1R, LgBiT-CAAX, and SmBiT-β-arrestin-FlAsH biosensors. (c) For β-arrestin conformations in endosomes, HEK293T cells were transfected with FLAG-AT1R, 2xFYVE-LgBiT, and SmBiT-β-arrestin-FlAsH biosensors. Cells were then labeled with the arsenic dye FlAsH-EDT2 or HBSS mock label and stimulated with 1 μM AngII or 10 μM TRV023. ΔNet BRET ratio was calculated by subtracting the net BRET values of FlAsH-labeled cells from the mock-labeled condition. Data represents mean ± SEM of n independent biological replicates. For AT1R, FlAsH 1: n=3, FlAsH 2,4: n=4, FlAsH 3, 5, 6: n=5. For CAAX, FlAsH 1–4: n=4, FlAsH 5: n=5, FlAsH 6: n=6. For 2xFYVE, FlAsH 1–5: n=4, FlAsH 6: n=3. Data with TRV023 has the same number of replicates as AngII, except FlAsH 5 (CAAX): n=7 and FlAsH 2 (FYVE): n=5.

