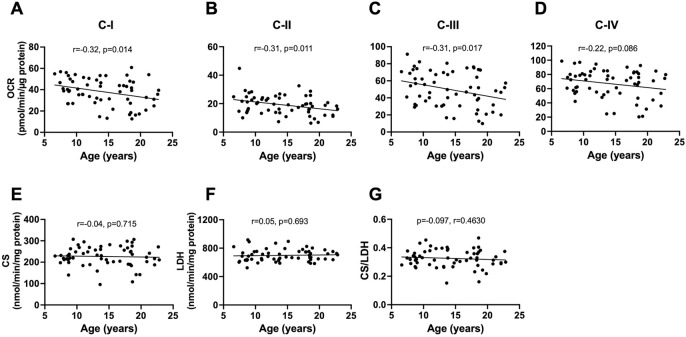
Fig. 1:
Linear regression of mitochondrial bioenergetics in the prefrontal cortex with age in male and female baboons. Data from male and female baboons were pooled. Plots of mitochondrial complexes activities: C-I (A), C-II (B), C-III (C), and C-IV (D) versus donor age. Citrate synthase (CS) activity (E), lactate dehydrogenase (LDH) activity (F), and CS to LDH ratio (G) were also regressed against age. The slope of the regression is represented by a thick line, and each individual dot represents data from an individual animal (n=60).

