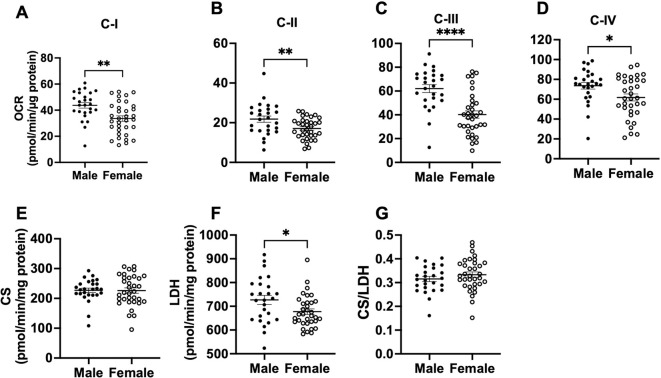
Fig. 3:
Comparison of mitochondrial complexes I-IV, citrate synthase, and lactate dehydrogenase activities in the prefrontal cortex between male and female baboons. Mitochondrial complex I (C-I) activity (A), C-II activity (B), C-III activity (C), C-IV activity (D), citrate synthase activity – CS (E), lactate dehydrogenase – LDH (F), and LDH to CS ratio (G) between male and females. Each dot represents data from an individual animal, with filled dots representing males (n=24) and open dots representing females (n=36). Error bars indicate mean ± SEM. Statistical significance was determined using t-test, with *p < 0.05, **p < 0.01, and ****p < 0.0001 indicating significance levels.

