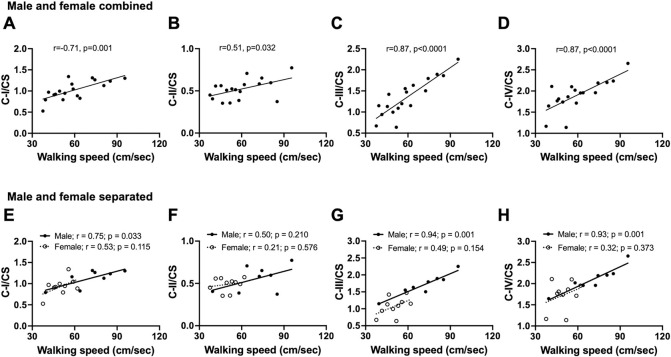
Fig. 7:
Correlation between walking and normalized mitochondrial activities in the prefrontal cortex of male and female baboons. Pearson’s correlation of walking speed with citrate synthase (CS)-normalized mitochondrial complex I: C-I/CS (A), complex II: C-II/CS (B), complex III: C-III/CS (C), or complex IV: C-IV/CS (D) in combined data from male and female baboons (n=18). Regression line represented by a thick line, and each individual filled dot representing data from an individual animal. Sex-specific relationship between walking speed and C-I/CS (E), C-II/CS (F), C-III/CS (G), or C-IV/CS (H). Filled dots and the thick line depict individual male data and their regression line, respectively, n=8, while open dots and the dashed line represent female data and their regression line, respectively, n=10.

