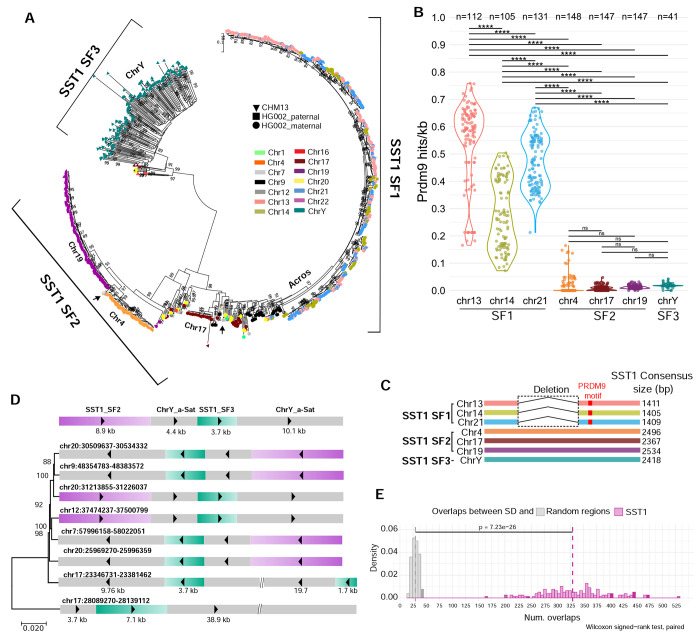
Figure 2. Evidence for SST1-mediated interchromosomal exchange in human genomes.
A) All SST1 monomers from CHM13 and HG002 were collected and phylogenetic analysis was performed using the maximum likelihood method based on the best-fit substitution model (Kimura 2-parameter +G, parameter = 5.5047) inferred by Jmodeltest2 with 1,000 bootstrap replicates. Bootstrap values higher than 75 are indicated at the base of each node. The color indicates the source chromosome and the shape indicates the source genome. Three major subfamilies were identified: 1) subfamily 1, primarily on the acrocentrics, 2) subfamily 2, primarily on the remaining autosomes, and 3) subfamily 3, primarily on the Y chromosome. Black arrows indicate the location on the phylogenetic trees of sf2 monomers S and L from the acrocentric chromosomes (Figure 1B). B) Predicted PRDM9 DNA binding site frequency (mean sites/kb, each dot indicates 1 haplotype) in SST1 arrays in multiple haploid genomes (indicated by n), plotted by chromosome. ANOVA analysis with the Tukey-Kramer test for pairwise mean comparisons was used. **** indicates p<0.0001 and ns indicates not significant. C) Schematic representation of the three subfamilies of SST1. SST1 sf1 has a central gap and a predicted PRDM9 DNA binding site (red box). D) A segmental duplication of 27 kb or larger was identified on several autosomes in CHM13 that includes Y-like alpha-satellite DNA and Y-like SST1. Phylogenetic analysis was performed using the maximum likelihood method and GTR+Gamma substitution parameters. Bootstrap values are shown. E) Comparison of overlaps between segmental duplications (SD) and random regions (gray) or SST1 monomers (pink) across 147 genomes. Distributions show the number of overlaps (x-axis) versus density (y-axis). A permutation test with 10000 iterations per genome was used to generate random region overlaps. The significant difference between distributions (p value = 7.23e-26, Wilcoxon signed-rank test, paired) indicates non-random association between SD and SST1 regions.

