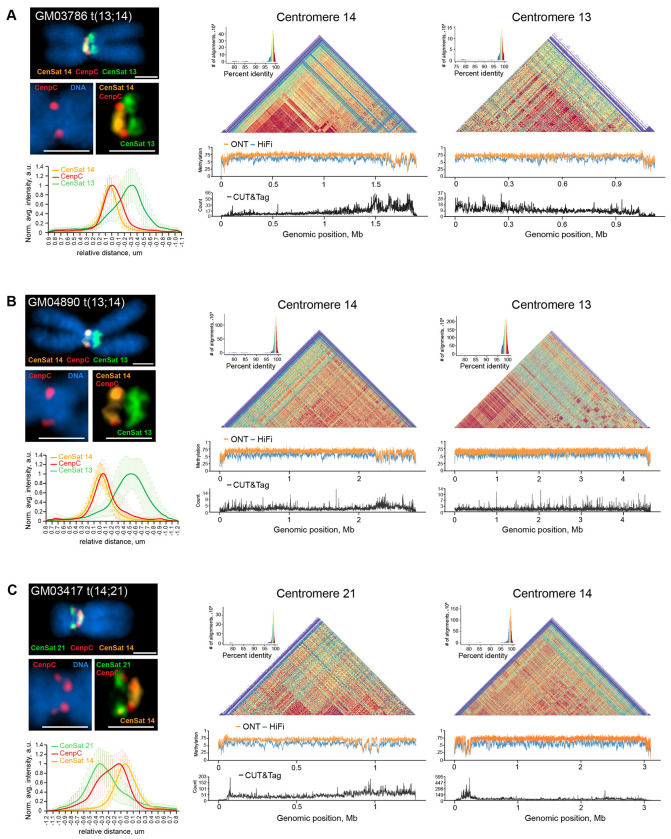
Figure 4. Centromere activity in dicentric ROBs.
ImmunoFISH, DNA methylation, and CENP-A CUT&Tag analyses were performed for (A) GM03486, (B) GM04890 and (C) GM03417. The left panels show representative structured illumination super-resolution images of ROBs labeled by immuno-FISH with centromeric satellite probes for CenSat 14/22 (orange), CenSat 13/21 (green), and anti-CENP-C antibody (red). DNA was counterstained with DAPI. Magnified insets depict single CENP-C foci on centromere 14 in GM03786 and GM04890, and double CENP-C foci on centromeres 21 and 14 in GM03417. Scale bar is 1 μm. Plots below show averaged intensity profiles of lines drawn through the centromeric regions of sister chromatids of at least 10 ROBs. Intensity profiles were aligned to the peak of the Gaussian of the CenSat 14 signal and normalized to the maximum intensity of each channel. Error bars denote standard deviations. The right panels display corresponding heatmaps of sequence similarity calculated for 5 kb bins for each centromere. Below the heatmaps, DNA methylation tracks show methylation calls from ONT (orange) or PacBio HiFi (blue) sequencing, with hypomethylated regions suggesting active centromere localization. Active centromere regions are confirmed by CENP-A peaks on CUT&Tag tracks below (black).

