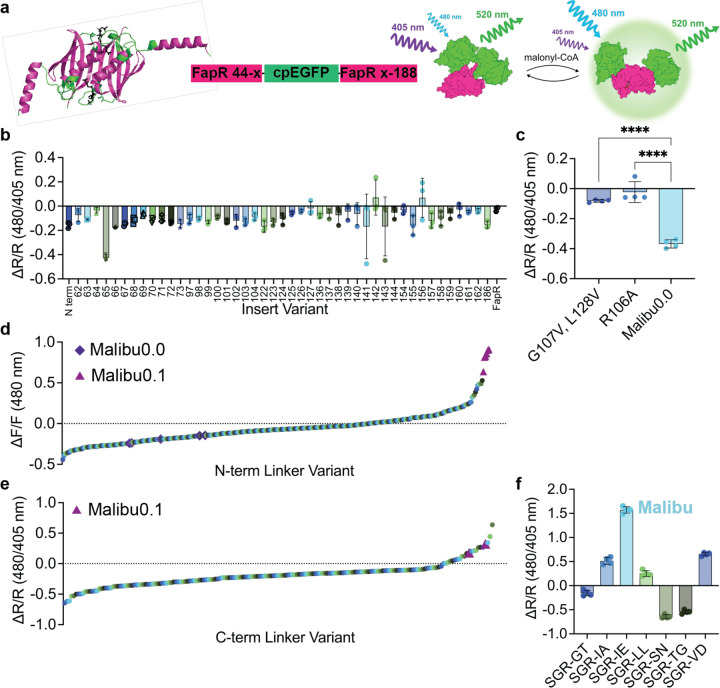
Figure 1. Development of Malibu.
a, Design and domain layout of Malibu. Crystal structure of FapR, without the N-terminal DNA binding domain, with residues where cpEGFP was inserted highlighted in green and malonyl-CoA in black (PBD ID 2F3X).
b, Ratio change (ΔR/R) after addition of 500 μM malonyl-CoA of initial Malibu variants in clarified bacterial lysate (n = 3 trials).
c, Ratio change of Malibu0.0 point mutants expected to minimally bind malonyl-CoA, along with Malibu0.0, treated with 500 μM malonyl-CoA in clarified bacterial lysate (n = 4 trials; p < 0.0001, ordinary one-way ANOVA with Dunnett’s multiple comparisons).
d, Fluorescence change of N-terminal linker variants screened in clarified bacterial lysate, treated with 500 μM malonyl-CoA. Performance of Malibu0.0 control replicates (purple diamond) and Malibu0.1 (pink triangle) denoted.
e, Ratio change of C-terminal linker variants screened in clarified bacterial lysate, treated with 450 μM malonyl-CoA. Performance of Malibu0.1 control replicates (pink triangle) denoted.
f, Ratio change of top hits from C-terminal linker screen in clarified bacterial treated with 450 μM malonyl-CoA (n = 4 trials).
For all figures, dot plots show the mean ± SD.

