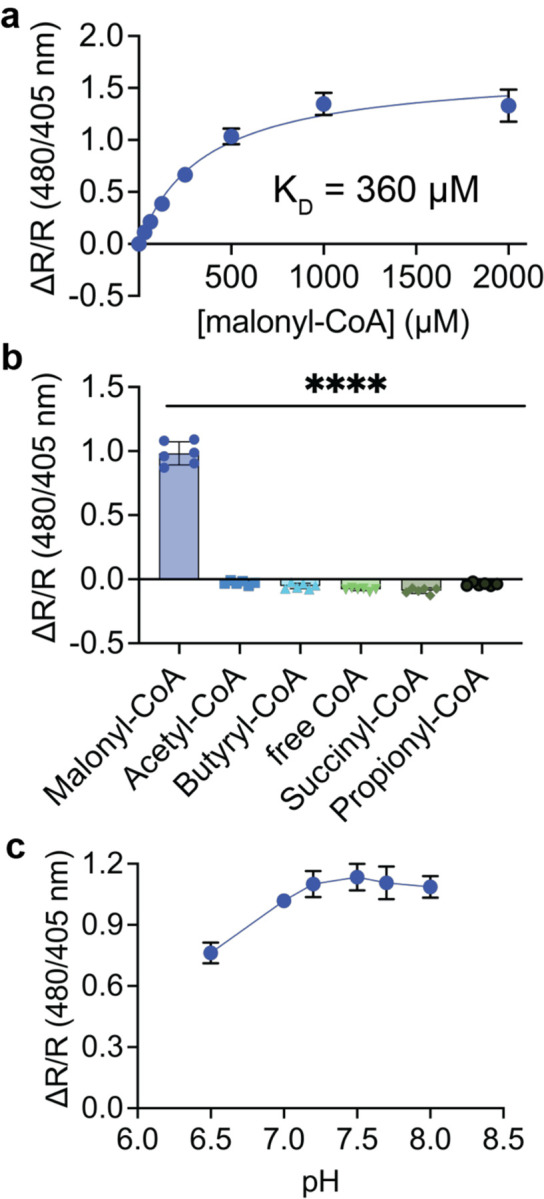
Figure 2. In vitro characterization of Malibu.

a, Dose-response curve for Malibu ratio changes in response to multiple concentrations of malonyl-CoA. Shown are the average ± standard deviation of 18 trials from three independent protein preparations. KD was determined using nonlinear fit.
b, Selectivity of Malibu towards malonyl-CoA, as measured by ratio change. Malibu was incubated with 500 μM of each respective CoA-containing molecule indicated (6 trials from 2 independent protein preparations; p < 0.0001, ordinary one-way ANOVA with Dunnett’s multiple comparison’s test).
c, pH dependency of Malibu ratio changes in response to 500 μM malonyl-CoA between pH 6.5–8, averaged across 8 trials from two independent protein preparations.
For all figures, plots show the mean ± SD.
