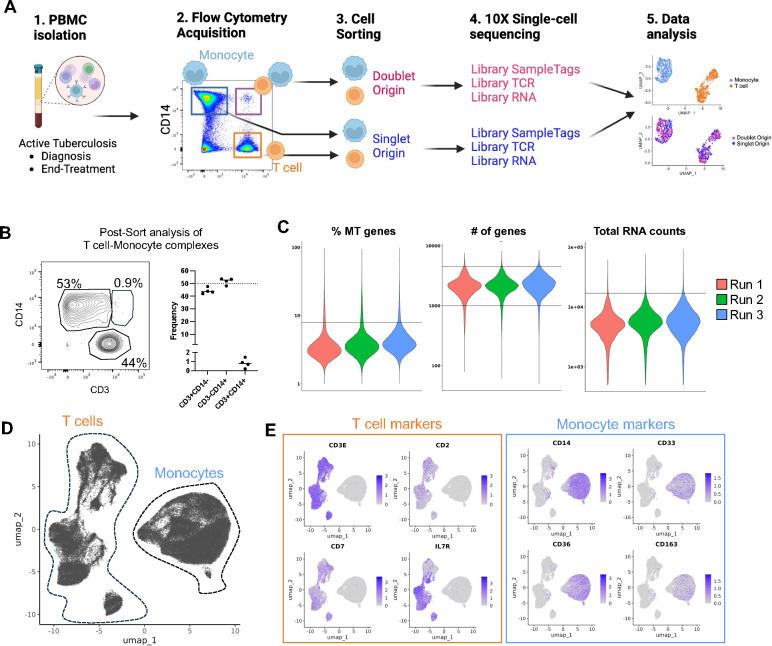
Figure 1: Determination of the single-cell transcriptome of thousands of T cells and monocytes forming complexes in ATB.
A) Methodological workflow used to obtain the single-cell transcriptome and TCR repertoire of T cells and monocytes forming complexes (pink red, doublet origin) or singlet T cells and monocytes (blue, singlet origin) from cryopreserved human PBMC samples from ATB patients with samples collated at diagnosis and/or end-of-treatment, created with Biorender. B) Re-acquisition by flow cytometry of sorted T cell-Monocyte complexes in PBMC samples from four ATB patients at diagnosis. C) Percentage of mitochondrial genes, number of genes, and total RNA counts per cell across all three experimental runs. Black lines represent the thresholds used to remove suspected doublets and low-quality cells. D) Uniform manifold approximation and projection (UMAP) representation of all cells based on single-cell RNA reads. E) UMAP feature plot showing the expression level of canonical T cell and monocyte markers. Data were derived from 68,142 total cells, from 18 PBMC samples (Figure S1C).

