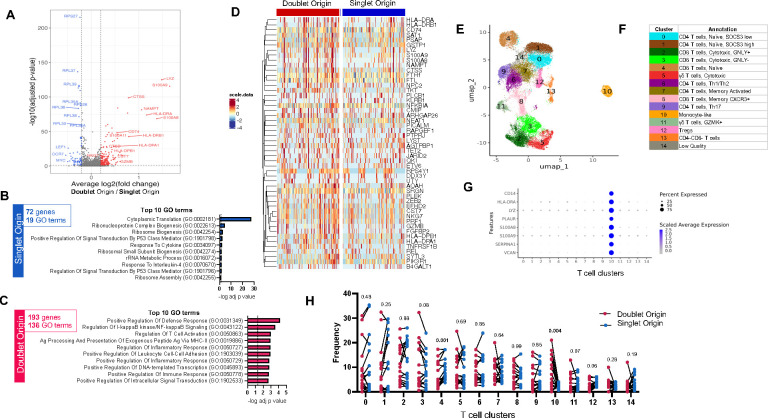
Figure 2: DO T cells are associated with a specific gene expression signature.
A) Volcano plot of differentially expressed genes (DEGs) comparing doublet origin (DO) versus singlet origin (SO) T cells. Red dots represent DEGs upregulated in DO T cells (adjusted p-value < 0.05, average log2 fold change > 0.2), and blue dots represent DEGs upregulated in SO T cells (adjusted p-value < 0.05, average log2 fold change < −0.2). P-values were adjusted based on Bonferroni correction. B) Top 10 GO terms significantly associated with the 72 genes upregulated in SO T cells. C) Top 10 GO terms significantly associated with the 193 genes upregulated in DO T cells. D) Heatmap representation of the top 50 DEGs upregulated in DO T cells. Each column represents one DO or SO T cell. Color scale denotes RNA expression level after scaling. For visualization, SO T cells were randomly downsampled to have the same sample size as DO T cells. E) UMAP representation and F) manual cluster annotation of DO and SO T cells. G) Monocyte gene expression across all T cell clusters. H) T cell cluster composition differences between DO (red dots) and SO (blue dots) T cells paired by sample, using non-parametric paired Wilcoxon tests. Data were derived from 3,285 DO and 26,957 SO T cells, from 17 PBMC samples (Figure S1C).

