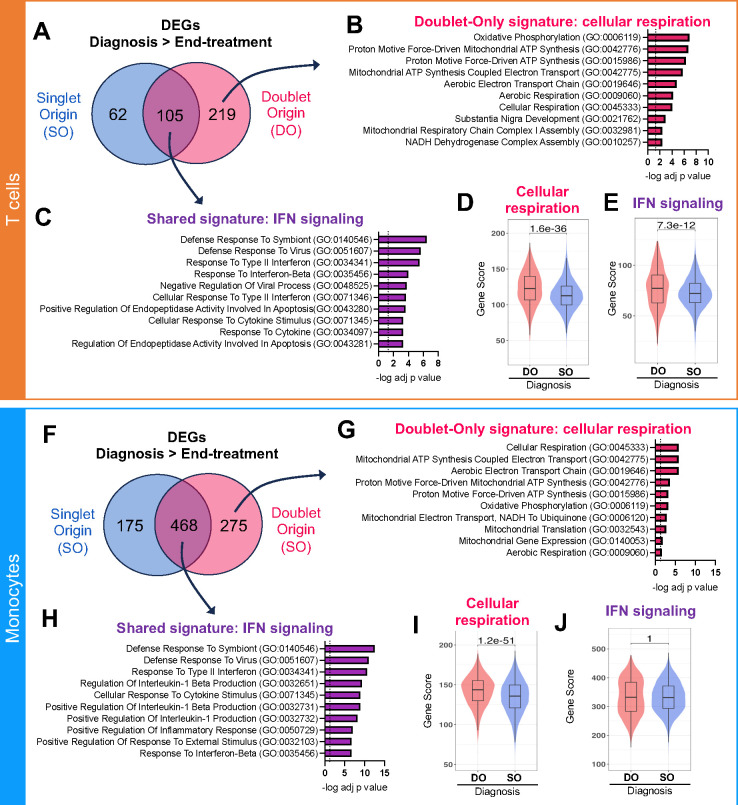
Figure 4: Increased immune activation in DO T cells and monocytes in ATB at diagnosis.
A) Overlap between upregulated DEGs (adjusted p-value with Bonferroni correction <0.05, average log2 fold change > 0.2) at diagnosis versus end-of-treatment in singlet origin (SO, blue) and doublet origin (DO, pink red) origin T cells. B) Top 10 GO terms significantly associated with the 219 DEGs upregulated at diagnosis in DO but not SO T cells (i.e., doublet-only signature), indicating a strong association with cellular respiration. C) Top 10 GO terms significantly associated with the 105 genes upregulated at diagnosis in both SO and DO T cells (i.e., shared signature), indicating a strong association with IFN signaling. Distribution of the D) cellular respiration gene signature score and E) IFN signaling gene signature score in DO versus SO T cells at diagnosis. The cellular respiration gene signature score represents the sum expression of the 219 DEGs upregulated at diagnosis versus end-of-treatment in DO but not SO T cells, as defined in A. The IFN signaling gene signature score represents the sum expression of the 105 DEGs upregulated at diagnosis versus end-of-treatment in both SO and DO T cells, as defined in A. F) Overlap between upregulated DEGs (adjusted p-value with Bonferroni correction <0.05, average log2 fold change > 0.2) at diagnosis versus end-of-treatment in singlet origin (SO, blue) and doublet origin (DO, pink red) origin monocytes. G) Top 10 GO terms significantly associated with the 275 DEGs upregulated at diagnosis in DO but not SO monocytes (i.e., doublet-only signature), indicating a strong association with cellular respiration. C) Top 10 GO terms significantly associated with the 468 genes upregulated at diagnosis in both SO and DO monocytes (i.e., shared signature), indicating a strong association with IFN signaling. Distribution of the D) cellular respiration gene signature score and E) IFN signaling gene signature score in DO versus SO monocytes at diagnosis. The cellular respiration gene signature score represents the sum expression of the 275 DEGs upregulated at diagnosis versus end-of-treatment in DO but not SO monocytes, as defined in A. The IFN signaling gene signature score represents the sum expression of the 468 DEGs upregulated at diagnosis versus end-of-treatment in both SO and DO monocytes, as defined in A. For the boxplots in D-E) and I-J), the lower, median, and upper edges represent the 25th, 50th, and 75th percentile; the length of the upper and lower whiskers is 1.5 times the interquartile range. Non-parametric unpaired Mann-Whitney tests were used for comparison between DO and SO cells, and Bonferroni correction was performed to adjust the p-value. Data were derived from seven diagnosis/end-of-treatment PBMC sample pairs, one unpaired diagnosis sample, and one unpaired end-of-treatment sample (Figure S1C).

