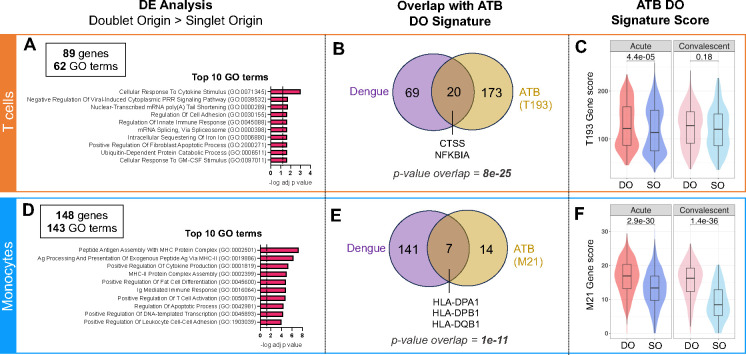
Figure 6: Circulating T cell-monocyte complexes in dengue hold similar transcriptomic signatures to ATB.
The single-cell transcriptome of T cells and monocytes forming complexes (DO) or singlet T cells and singlet monocytes (SO) from 15 cryopreserved human PBMC samples from patients with dengue, with blood collected at either the acute (four to five days since symptom onset) or convalescent phase (14 to 21 days since symptom onset) were obtained by following the same workflow as for ATB (Figure 1A). Differential expression analysis between DO and SO cells was performed on T cells (top panel) and Monocytes separately (bottom panel). A) Top 10 GO terms significantly associated with the 89 genes significantly upregulated (adjusted p-value with Bonferroni correction <0.05, average log2 fold change > 0.2) in DO versus SO T cells. B) Overlap between genes significantly upregulated in DO versus SO T cells in dengue (purple) and ATB (yellow). The ATB signature of DO T cells (also referred to as T193) represents the 193 genes significantly upregulated in DO versus SO T cells in the ATB dataset, as defined in Figure 2A. C) Distribution of the T193 gene signature score in DO versus SO T cells in the dengue dataset, separating acute and convalescent samples. D) Top 10 GO terms significantly associated with the 148 genes significantly upregulated (adjusted p-value with Bonferroni correction <0.05, average log2 fold change > 0.2) in DO versus SO monocytes. E) Overlap between genes significantly upregulated in DO versus SO monocytes in dengue (purple) and ATB (yellow). The ATB signature of DO monocytes (also referred to as M21) represents the 21 DEGs upregulated in doublet versus SO T cells in the ATB dataset, as defined in Figure 3A. F) Distribution of the M21 gene signature score in DO versus SO monocytes in the dengue dataset, separating acute and convalescent samples. Non-parametric unpaired Mann-Whitney U tests were used for comparison between DO and SO cells, and Bonferroni correction was performed to adjust the p-value. Data were derived from 15 PBMC samples (Figure S4A).

