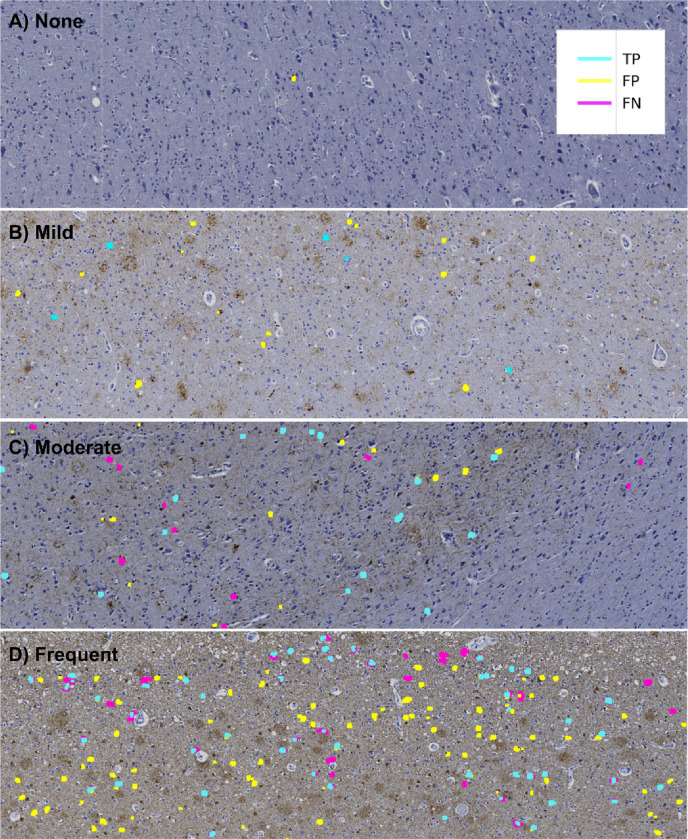
Figure 3. Agreement maps display how NFT predictions compare to human labels.
Agreement maps from four different ROIs in order of increasing semi-quantitative severity. As the slide-level severity score increases, the model detects more NFTs. However, False Positives (FPs, yellow) and False Negatives (FNs, magenta) increasingly appear as the severity increases. (A) None, (B) Mild, (C) Moderate, and (D) Severe CERAD-like NFT burden scoring by expert assessment. Notably, True Positive (TP, cyan) predictions display high pixel-wise boundary fidelity, and disagreement between human labels and model predictions more typically applies to whether the entire object qualifies as a mature NFT.

