Fig. 2:

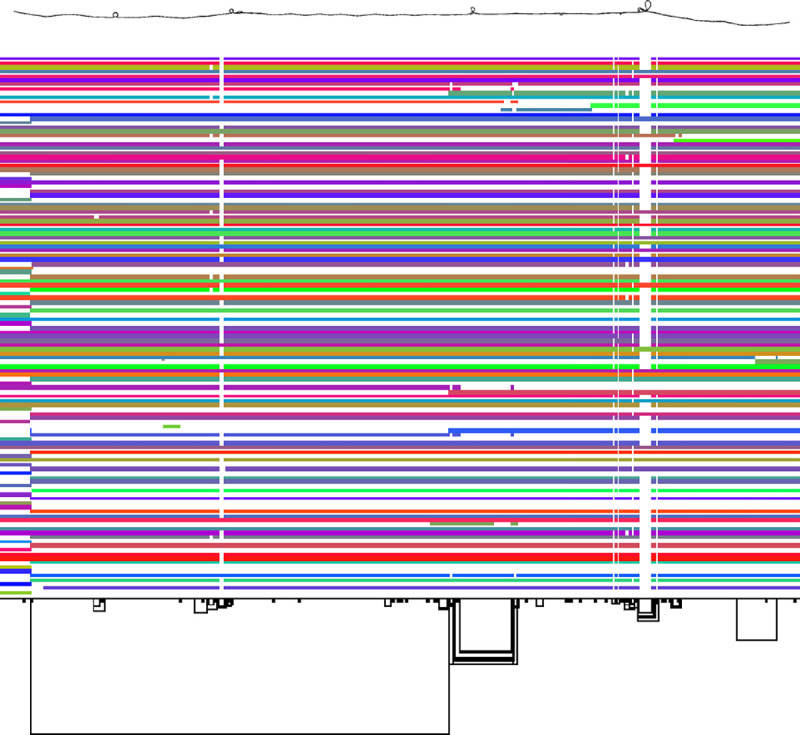
The pangenome graph of the human major histocompatibility complex (MHC) region of chromosome 6 of the PGGB graph of HPRC year 1 assemblies, with 2D graph visualization (above) and matrix view (below).

The pangenome graph of the human major histocompatibility complex (MHC) region of chromosome 6 of the PGGB graph of HPRC year 1 assemblies, with 2D graph visualization (above) and matrix view (below).