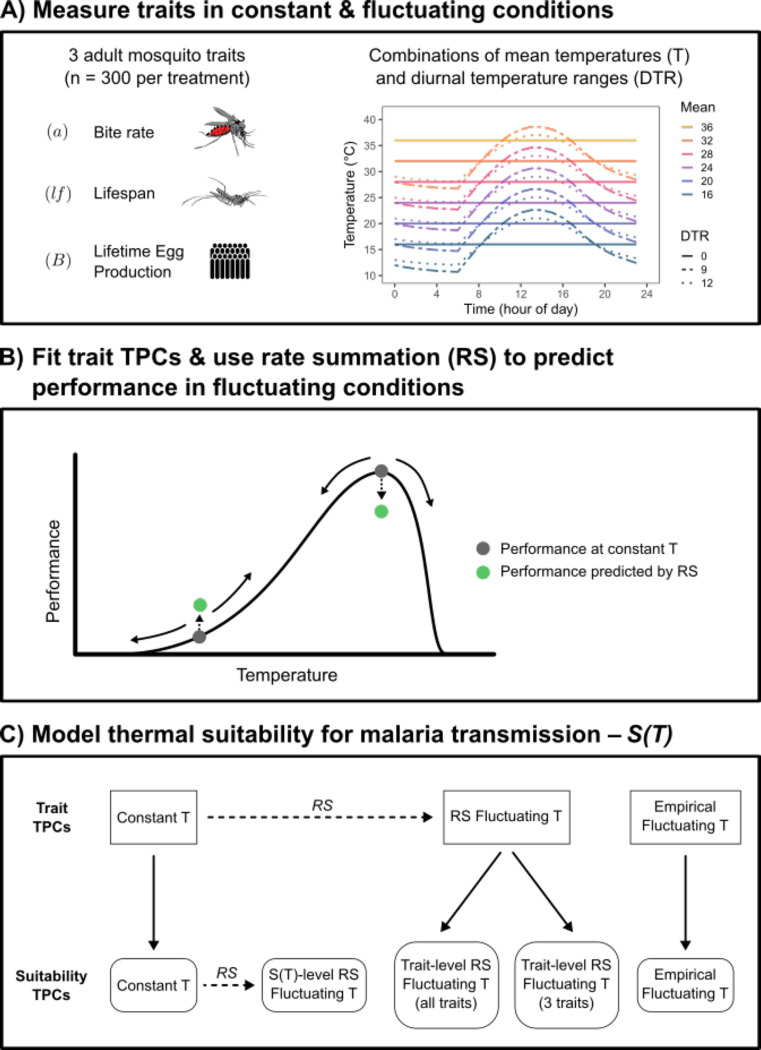
Figure 1: Conceptual figure summarizing the study.
A) We measured three adult mosquito traits (bite rate [a], lifespan [lf], and lifetime egg production [B]) in constant and fluctuating conditions (diurnal temperature range [DTR] = 0, 9, and 12°C) across a range of mean temperatures (mean temperatures = 16, 20, 24, 28, and 32°C for all DTR treatments; 36°C for DTR = 0°C only). B) For each trait, we fit thermal response curves (TPCs) to the data from each DTR treatment. Additionally, we used rate summation (RS) to predict performance in fluctuating environments based on the TPC fitted to data from constant environments. Compared to constant temperatures with the same mean (dark gray points), in fluctuating temperatures (solid arrows) rate summation will predict a decrease in performance over decelerating portions of a TPC (e.g., near the optimum) and an increase in performance over accelerating portions of a TPC (dashed arrow and green points). C) We compared five versions of a model predicting thermal suitability for transmission, S(T), parameterized with different trait TPCs. Model 1 (‘Constant T’) used TPCs fit to trait data from constant temperatures. Model 2 (‘Empirical Fluctuating T’) used TPCs fit to trait data from fluctuating temperatures. Models 3 and 4 used TPCs generated by applying rate summation to constant temperature TPCs for either the 3 focal traits measured here (model 3: ‘Trait-level RS Fluctuating T - 3 traits’) or all traits in the model (model 4: ‘Trait-level RS Fluctuating T - all traits’). Model 5 (‘S(T)-level RS Fluctuating T’) applied rate summation directly to the TPC for suitability generated in model 1. Dashed arrows denote RS calculations and solid arrows denote parameterizing the suitability model with trait TPCs.

