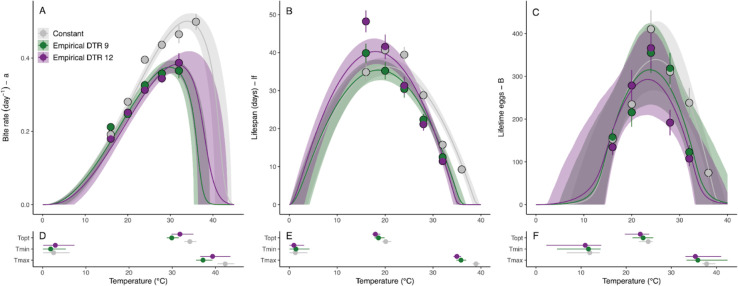
Figure 2: Empirically measured thermal responses for three adult Anopheles stephensi traits in constant and diurnally fluctuating temperatures.
Traits include: bite rate (a, left column), lifespan (lf, center column) and lifetime egg production (B, right column). Colors denote daily temperature range (DTR) treatment: 0°C (gray), 9°C (green), and 12°C (purple). A-C) Summarized data and thermal performance curves (TPCs). TPC contours show posterior distribution medians, with 95% credible intervals as shaded areas. Points and error bars display block means and standard errors for visual comparison between treatments. (TPCs were fit to individual-level data.) D-F) Key temperature values from the TPCs: thermal optimum (Topt), thermal minimum (Tmin), and thermal maximum (Tmax). Points display posterior distribution medians and error bars display 95% credible intervals.

