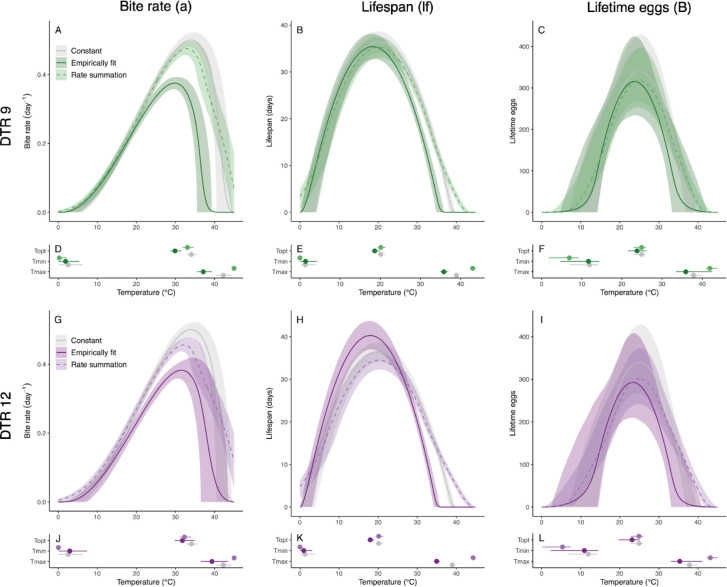
Figure 3: Thermal performance based on empirical observations or predictions generated by rate summation for Anopheles stephensi performance in diurnally fluctuating temperature environments.
Left column: bite rate (a), center column: lifespan (lf), right column: lifetime egg production (B). Top row (green): daily temperature range (DTR) 9°C, bottom row (purple): DTR 12°C. Darker hues and solid lines show thermal performance curves (TPCs) fit to empirical data collected from mosquitoes housed in diurnally fluctuating temperature conditions. Light hues and dashed lines show predictions generated by rate summation. TPCs fit to empirical data collected from mosquitoes housed across constant temperature conditions shown in gray for comparison.

