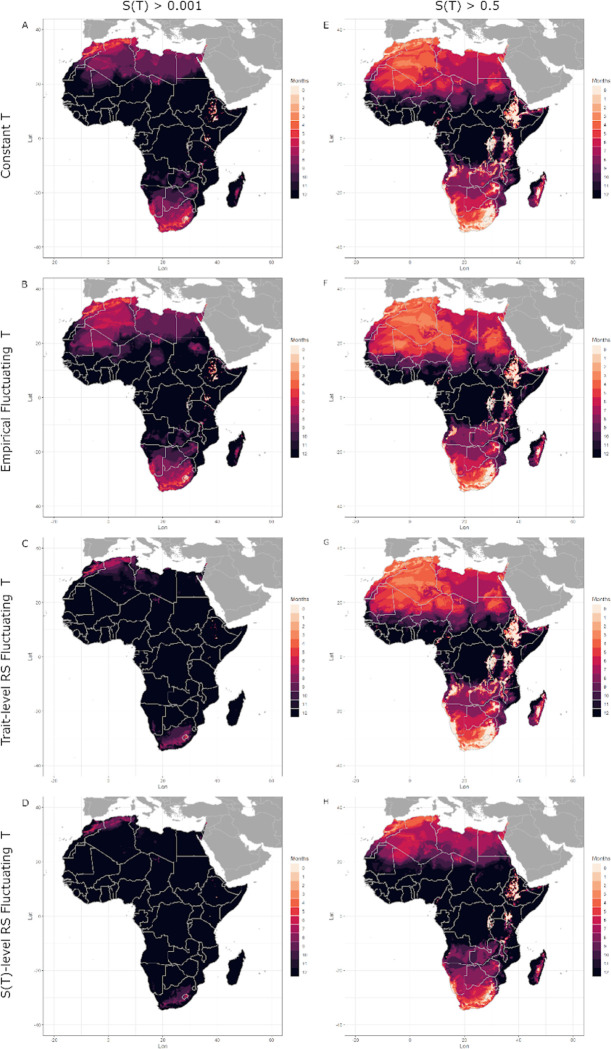
Figure 6: Months of thermal suitability, S(T), for transmission of malaria by Anopheles stephensi in its invading range in Africa predicted by models parameterized using constant and fluctuating temperatures.
Left column: total months where is predicted to exceed 0.001 (i.e. when transmission is possible). Right column: total months where is predicted to exceed 0.5 (i.e. when transmission is relatively favored by temperature). Darker hues indicate more months. Top row: model 1 (constant T) uses trait TPCs fit to data across a range of constant temperatures; second row: model 2 (empirical fluctuating T) uses trait TPCs fit to data across a range of fluctuating temperatures; third row: model 4 (trait-level RS - all traits), uses trait TPCs generated by applying rate summation to TPCs fit to data from constant temperatures for all traits; bottom row: model 5 (-level RS), applies rate summation to the TPC for suitability generated from traits measured across a range of constant temperatures (i.e. the output of version 1). Fluctuating temperature models used a daily temperature range (DTR) = 12°C.

