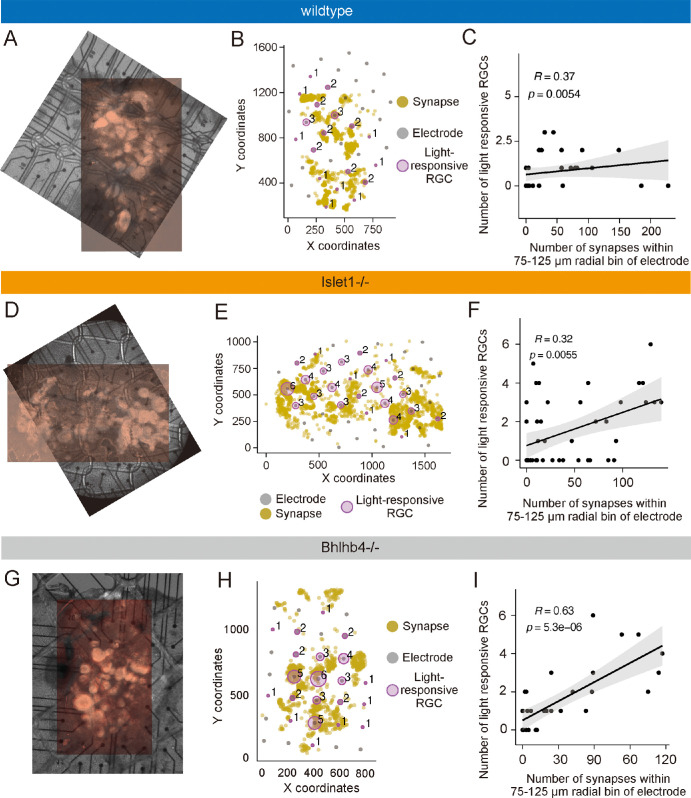
Figure 4.
Host-graft synapse coordinates and multielectrode array (MEA) recording results. (A) Flat-mount confocal image of retina transplanted with wildtype graft, aligned and overlayed with the infrared image with tdTomato fluorescence taken after MEA recording. (B) Coordinates of host-graft synapse (yellow dots) and MEA electrodes (gray dots). The numbers of light-responsive host retinal ganglion cells (RGCs) were represented with the radius of the magenta circle with the number alongside. (C) Result of Spearman's rank correlation test between host-graft synapse numbers within 75 to 125 µm radial bin of MEA electrode and the number of light responsive RGC numbers detected by that electrode after wildtype graft transplantation. (D–F) Equivalent result to panels A to C obtained after Islet1−/− transplantation. (G–I) Equivalent result to panels A to C obtained after Bhlhb4−/− transplantation.

