Abstract
Purpose
It has been noted that, at higher prevalences, the rate of change in the prevalence of high myopia seems to be disproportionately greater compared with the rate of change in the prevalence of myopia. A simple, evidence-based explanation for this relationship is offered.
Methods
Using a convenience sample of 41 datasets with prevalence estimates for at least two refractive error thresholds (e.g., −0.50 and −6.00 D) the common slope of the logit vs. refractive threshold was applied to model expected rates of high myopia across the myopia prevalence range and the corresponding ratio of change in high myopia to myopia prevalence.
Results
The logit of high myopia is related linearly to the logit of myopia. The ratio of increase in high myopia prevalence to that for myopia prevalence increases with underlying prevalence. For example, an increase in myopia prevalence from 19% to 20% is modelled to be accompanied by a 0.1% increase in the prevalence of high myopia from 1.55% to 1.65%—a ratio of 0.1. Conversely, an increase in myopia prevalence from 79% to 80% is predicted to result in a 1% increase in the prevalence of high myopia from 20.6% to 21.6%—a ratio of 1.0.
Conclusions
The increase in the prevalence of high myopia compared with that of myopia as the latter increases is merely a function of the underlying nature of refractive error probability distributions and requires no further investigation as to its origin.
Translational Relevance
This study shows how the prevalence of myopia and high myopia are inter-related. A widespread effort to slow myopia progression will affect the prevalence of high myopia but not myopia in general. In contrast, efforts to delay myopia onset will affect both.
Keywords: myopia, high myopia, prevalence, children, axial length, myopia control
Introduction
The prevalence of myopia and high myopia, typically defined as −6.00 D or worse, are both increasing, particularly in east Asia.1 A 2021 International Myopia Institute (IMI) report on the impact of myopia,2 noted that “the rate of change in prevalence of high myopia appears to be disproportionately greater compared with the rate of change in the prevalence of myopia” in East Asian and Asia-Pacific countries. For example, over a 15-year period, the prevalence of myopia among high school students in Fenghua City in mainland China, increased from 79.5% to 87.7% while the prevalence of high myopia more than doubled from 8.0% to 17.5%.3 Similarly, in Taiwan, the prevalence of myopia among first year university students increased from 91.3% to 95.9% over 18 years, but the prevalence of high myopia grew from 23.5% to 38.4%.4 The IMI authors2 hypothesize that a number of factors may be responsible for this disproportionate increase in the prevalence of high myopia, including children developing myopia at earlier ages than before,5 faster myopia progression in Asian children compared with other races,6,7 and a faster rate of myopia progression in younger compared with older children.8,9
Assessment of distributions by prevalence values presents statistical challenges. A preferred approach is to use the logit function, that is the log of the odds, because of its amenability to statistical analysis. Prevalence values are bound at both ends (0% to 100%), odds are bound at the lower end (0 to infinity), where the logit is symmetrical around 0 and continuous from –infinity to +infinity. Here, we apply this approach and examine a sample of studies containing prevalence data to draw inferences on the origin of the putative disproportionate increase in the prevalence of high myopia.
Methods
We have identified previously 41 sets of data from 22 papers to develop a preliminary universal calculator for myopia prevalence.10 This convenience sample was untargeted other than (i) using populations that were not selected on the basis of refractive distribution, (ii) incorporating a wide spread of overall myopia rates from a wide range of locations, and (iii) for the purpose of the current analysis, using only data from adults. The minimum age of subjects was 21 years, but most were over 40 years of age. The bulk of the studies were conducted in East Asia. Data from more than 67,000 participants were included in the overall analysis and a summary is included in the Supplementary Content. The datasets consisted of prevalence estimates for at least two refractive error thresholds, for example, −0.50 and −6.00 D. Because all studies were on adults, prevalence was no greater than 70.3%, less than the studies on children discussed elsewhere in this article. Nonetheless, this does not affect the generality of our observations.
For each of the 41 datasets the prevalence at each myopia threshold was converted to the odds of myopia (= prevalence/[1 – prevalence]). For each the logit of myopia (natural log of the odds) was then calculated and plotted as a function of the threshold/criterion for myopia.
The mean slope of this logit function was then applied to model (i) expected rates of high myopia (−6.00 D) vs. myopia (−0.50 D) prevalence for the adult population and (ii) the corresponding ratio of change in high myopia to myopia prevalence.
Results
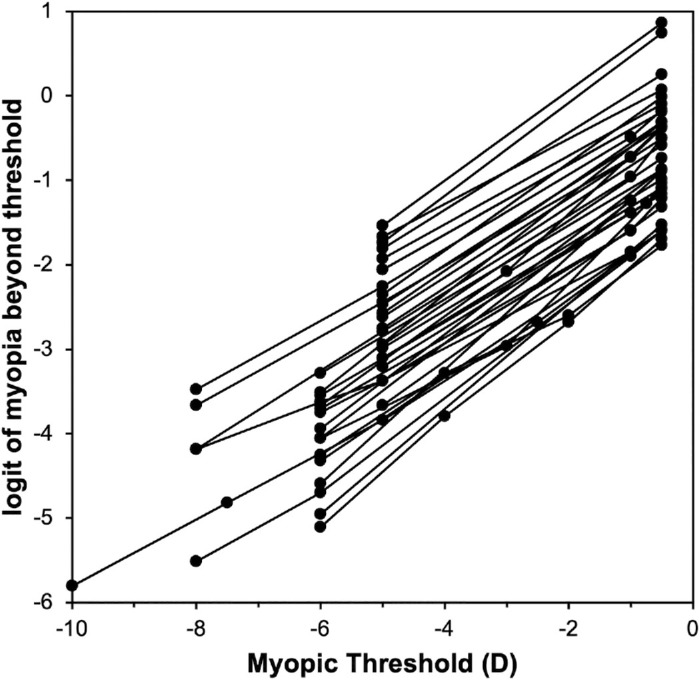
The slope of the logit vs. refractive error threshold is highly consistent across populations, even in the face of vastly different underlying myopia prevalence (Fig. 1). In other words, knowledge of a single point in a distribution, even the mean refractive error, is thus sufficient to describe the entire myopic distribution. The observed linear relationship was used to adjust the prevalence of myopia at −6.00 D or worse when other criteria had been used for high myopia (usually −5.00 D).
Figure 1.

Logit of myopia as a function of threshold for 43 adult datasets.
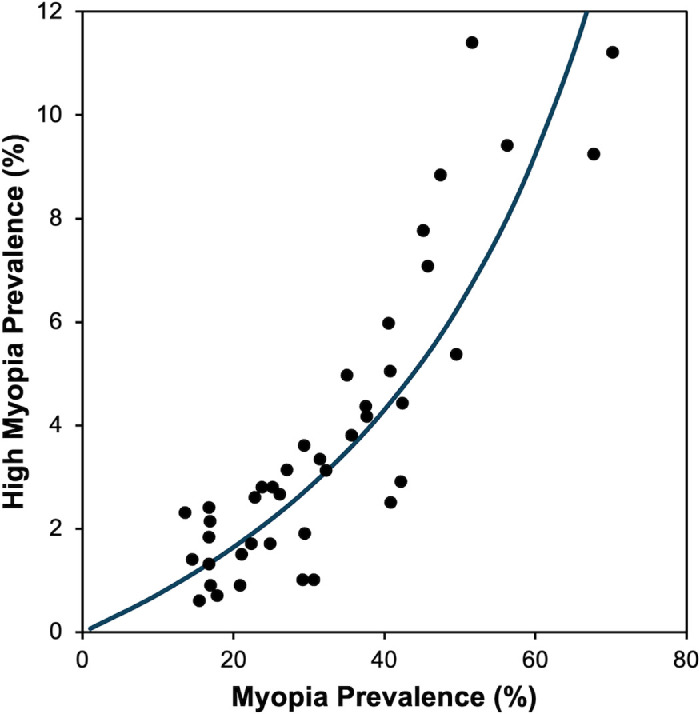
In the 41 populations in the 22 papers, the prevalence of myopia (≤−0.50 D) ranged from 13.6% to 70.3%, whereas the prevalence of high myopia (≤−6.00 D) ranged from 0.6% to 11.4%. Figure 2 plots the prevalence of high myopia vs. the prevalence of myopia. Consistent with the observations described in the Introduction, the prevalence of high myopia increases more sharply at higher prevalences of myopia.
Figure 2.

Prevalence of high myopia (≤−6.00 D) vs. prevalence of myopia (≤−0.50 D). In some cases, adjustment was used to estimate prevalence of high myopia at ≤−6.00 D.
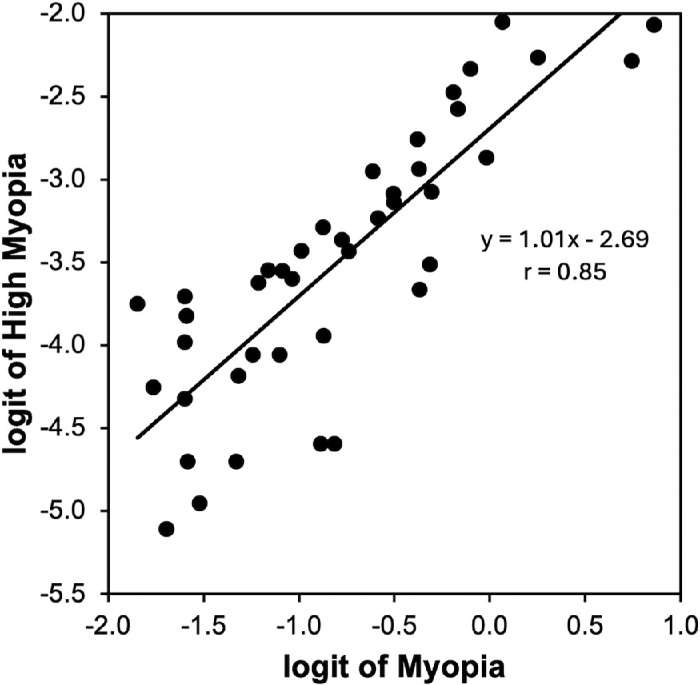
Figure 3 replots the data in Figure 2 using the logits of high myopia and myopia. The data are well fit with a straight line, confirming the relationship shown in Figure 1. The equation for the best fit line is
Figure 3.

Logit of high myopia (≤−6.00 D) vs. logit of myopia (≤−0.50 D). In some cases, adjustment was used to estimate logit of high myopia at ≤−6.00 D.
The value of near unity (1.01) for the slope confirms our observation of consistency of slopes in Figure 1. The intercept (−2.69) reflects the difference between the logits at the −0.50 and −6.00 D thresholds and will, of course, vary for different thresholds for myopia and high myopia.
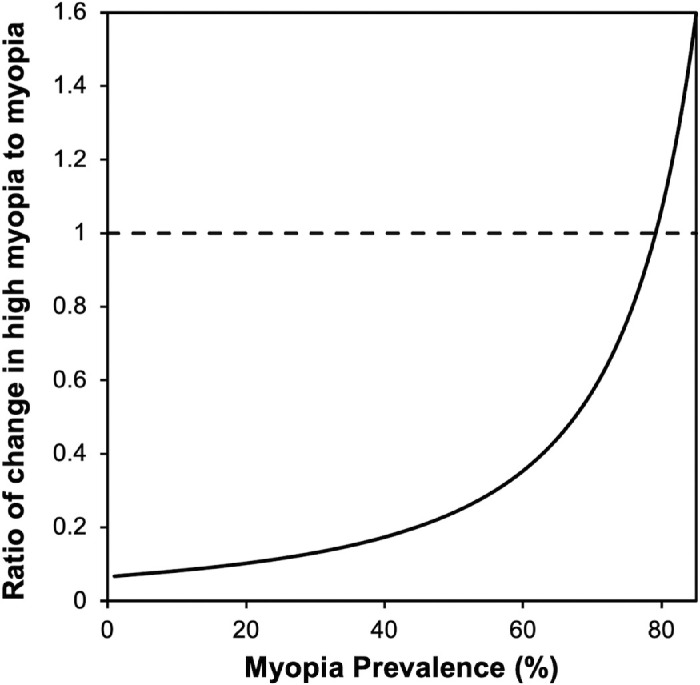
Figure 4 plots the ratio of the estimated change in high myopia prevalence to that for myopia, that is, the change in the prevalence of high myopia for every 1% increase in the prevalence of myopia. It is noticeable that, at approximately 80% myopia prevalence, high myopia prevalence will increase by a greater increment than for myopia; that is, the ratio is above a value of 1.0.
Figure 4.

Modelled ratio of change in high myopia to myopia prevalence based on the relationship shown in Figure 3.
Discussion
This analysis clearly shows that there is a predictable but nonlinear relationship between the prevalence of myopia and the prevalence of high myopia. One ramification of the nonlinearity is that, at low prevalences of myopia, a unit increase in the prevalence is accompanied by a very small increase in the prevalence of high myopia. In contrast, at higher myopia prevalences, each unit increase is accompanied by a greater increase in the prevalence of high myopia. For example, an increase in myopia prevalence from 19% to 20% is modelled to be accompanied by only a 0.1% increase in the prevalence of high myopia from 1.55% to 1.65%—a ratio of 0.1, as observable in Figure 4. Conversely, an increase in myopia prevalence from 79% to 80% results in a 1% increase in the prevalence of high myopia from 20.6% to 21.6%—a ratio of 1.0.
This analysis demonstrates the pitfall of using prevalence values in interpreting distributions. Although they are easy to interpret, the logit function's range from negative to positive infinity and symmetry around the zero point allows for easier statistical manipulation. The advantage of using this is exemplified by Figure 1 and confirmed in Figure 3, where the logits of high myopia, at a threshold of −6.00D, and myopia, at −0.50D, are consistently different by 2.69.
Referring back to the two studies cited by the IMI authors2 and summarized in the Introduction, the study of Chinese high school students reported an increase in myopia prevalence from 79.5% to 87.7%—a difference of 8.2%—and increase in high myopia prevalence from 8.0% to 17.5%—a difference of 9.5%.3 The ratio is thus slightly above 1 and consistent with Figure 4. Likewise, the study of university students reported an increase in myopia prevalence from 91.3% to 95.9%—a difference of 4.6%—and increase in high myopia prevalence from 23.5% to 38.4%—a difference of 14.9%.4 The ratio is thus 3.3 and again consistent with Figure 4. The model predicts a ratio of 4.3. It should be noted that the high school study did not use cycloplegia and the university study used a criterion for myopia of −0.25 D. Both of these will impact the estimates of myopia prevalence, while having a modest influence on the prevalence of high myopia.
Our work has some limitations. The relationship between the logit and myopia threshold presented in Figure 1 arises from examination of a number of studies that were not subject to systematic review. Thus, some bias may exist. We have already identified in excess of 200 studies where prevalence values at multiple myopic thresholds are reported and incorporation of data from all of these studies was beyond the scope of this paper. Nevertheless, the consistency of slopes from this convenience sample gives us confidence that our interpretation is justified. The highest myopia prevalence (≤−0.50 D) of 70.3% was in a group of 40- to 49-year-old Japanese men.11 A higher prevalence has been observed in Asian teenagers but, although the slope between the logit and refractive threshold seems to be constant across prevalence at any given age, we have noted that the slope is age dependent in children, becoming constant in adults.10 Further research is required to quantify this effect. Estimates of the ratio between increase in high myopia and myopia at values higher than this required extrapolation. The pattern of an increasing ratio up to a myopia prevalence of 70% and the relative consistency with the above high school and university data (notwithstanding these being teenage samples) provide support for our general conclusion.3,4 Moreover, the observation that the ratio of high myopia to myopia increases with myopia prevalence in older populations demonstrates that the observation in the IMI report is not unique to younger populations.
In summary, the claimed disproportionate increase in the prevalence of high myopia compared with that of myopia as the latter is merely a function of, and entirely explainable by, the underlying nature of refractive error frequency distributions and requires no further investigation as to its origin. Although children are developing myopia at earlier ages5 and both Asian and younger children exhibit faster myopia progression,6–9 none of these factors are necessary to explain the relationship between the increase in the prevalence of high myopia compared with that of myopia in East Asian and Asia-Pacific countries.
Supplementary Material
Acknowledgments
Noel A. Brennan and Xu Cheng are employees of Johnson & Johnson. Mark Bullimore is a consultant for Alcon Research, Bruno Vision Care, CooperVision, EssilorLuxottica, Euclid Vision, Eyenovia, Genentech, Johnson & Johnson Vision, Novartis, Sydnexis, and Vyluma, and is the sole owner of Ridgevue Publishing and Ridgevue Vision. Preparation of this paper was supported by Johnson & Johnson.
Author Contributions: NAB conceived the manuscript and performed the analyses; MAB wrote the first draft of the manuscript and constructed the figures; NAB and XC reviewed the manuscript; all authors have read and agreed to the published version of the manuscript.
Disclosure: N.A. Brennan, (E); X. Cheng, (E); M.A. Bullimore, (C)
References
- 1. Holden BA, Fricke TR, Wilson DA, et al.. Global prevalence of myopia and high myopia and temporal trends from 2000 through 2050. Ophthalmology. 2016; 123: 1036–1042. [DOI] [PubMed] [Google Scholar]
- 2. Sankaridurg P, Tahhan N, Kandel H, et al.. IMI impact of myopia. Invest Ophthalmol Vis Sci. 2021; 62: 2. [DOI] [PMC free article] [PubMed] [Google Scholar]
- 3. Chen M, Wu A, Zhang L, et al.. The increasing prevalence of myopia and high myopia among high school students in Fenghua city, eastern China: a 15-year population-based survey. BMC Ophthalmol. 2018; 18: 159. [DOI] [PMC free article] [PubMed] [Google Scholar]
- 4. Wang TJ, Chiang TH, Wang TH, Lin LL, Shih YF.. Changes of the ocular refraction among freshmen in National Taiwan University between 1988 and 2005. Eye (Lond). 2009; 23: 1168–1169. [DOI] [PubMed] [Google Scholar]
- 5. Lin LL, Shih YF, Hsiao CK, Chen CJ.. Prevalence of myopia in Taiwanese schoolchildren: 1983 to 2000. Ann Acad Med Singapore. 2004; 33: 27–33. [PubMed] [Google Scholar]
- 6. Donovan L, Sankaridurg P, Ho A, Naduvilath T, Smith EL 3rd, Holden BA.. Myopia progression rates in urban children wearing single-vision spectacles. Optom Vis Sci. 2012; 89: 27–32. [DOI] [PMC free article] [PubMed] [Google Scholar]
- 7. Brennan NA, Shamp W, Maynes E, et al.. Influence of age and race on axial elongation in myopic children: a systematic review and meta-regression. Optom Vis Sci. 2024; 101: 496–506. [DOI] [PubMed] [Google Scholar]
- 8. Chua SY, Sabanayagam C, Cheung YB, et al.. Age of onset of myopia predicts risk of high myopia in later childhood in myopic Singapore children. Ophthalmic Physiol Opt. 2016; 36: 388–394. [DOI] [PubMed] [Google Scholar]
- 9. Hu Y, Ding X, Guo X, Chen Y, Zhang J, He M.. Association of age at myopia onset with risk of high myopia in adulthood in a 12-year follow-up of a Chinese cohort. JAMA Ophthalmol. 2020; 138: 1129–1134. [DOI] [PMC free article] [PubMed] [Google Scholar]
- 10. Brennan NA, Franklin N, Cheng X, Toubouti Y, Bullimore MA.. Preliminary analysis of an age-dependent universal calculator for myopia prevalence. Optom Vis Sci. 2020; 97:E-abstract 205355. [Google Scholar]
- 11. Sawada A, Tomidokoro A, Araie M, Iwase A, Yamamoto T, Tajimi Study G. Refractive errors in an elderly Japanese population: the Tajimi study. Ophthalmology. 2008; 115: 363–70.e3. [DOI] [PubMed] [Google Scholar]
Associated Data
This section collects any data citations, data availability statements, or supplementary materials included in this article.


