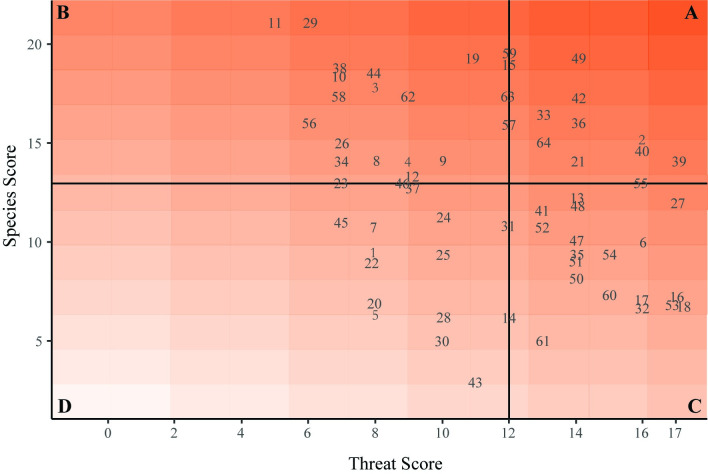
Fig 4. Conservation category of each sampling area based on species scores and threat scores.
Category A (high species, high threat); B (high species, low threat); C (low species, high threat); D (low species, low threat). Lines indicate the category thresholds and are based on the median values of the species score (a median of 13.0, horizontal line) and threat score (a median of 12.0, vertical line). Sampling areas plotted directly on a dotted line were assigned to the higher priority category.

