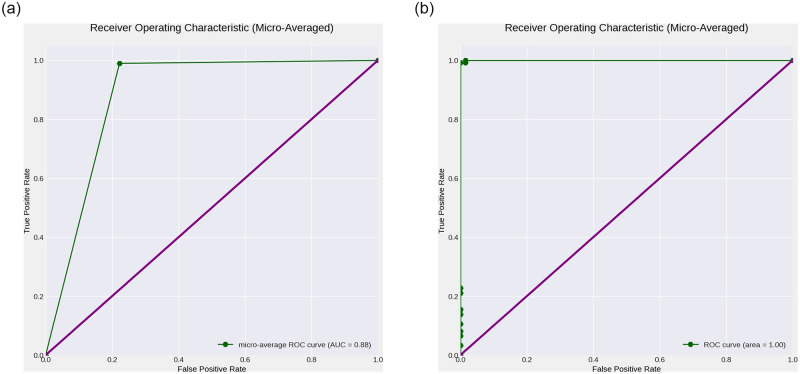
Fig 3. Receiver Operating Characteristic (ROC) (green) with Area under the ROC Curve (AUC) generated for the clinical case studies (Datasets 1 and 2).
ROC and AUC plots are generated for the best performing deep learning models for classifying Chest X-rays with and without Pneumonia, and CT scans with and without COVID-19. (a) ROC curve for Dataset 1 (Chest X-ray Scans for Pneumonia detection), (b) ROC curve for Dataset 2 (Chest CT Scans for COVID-19 detection).

