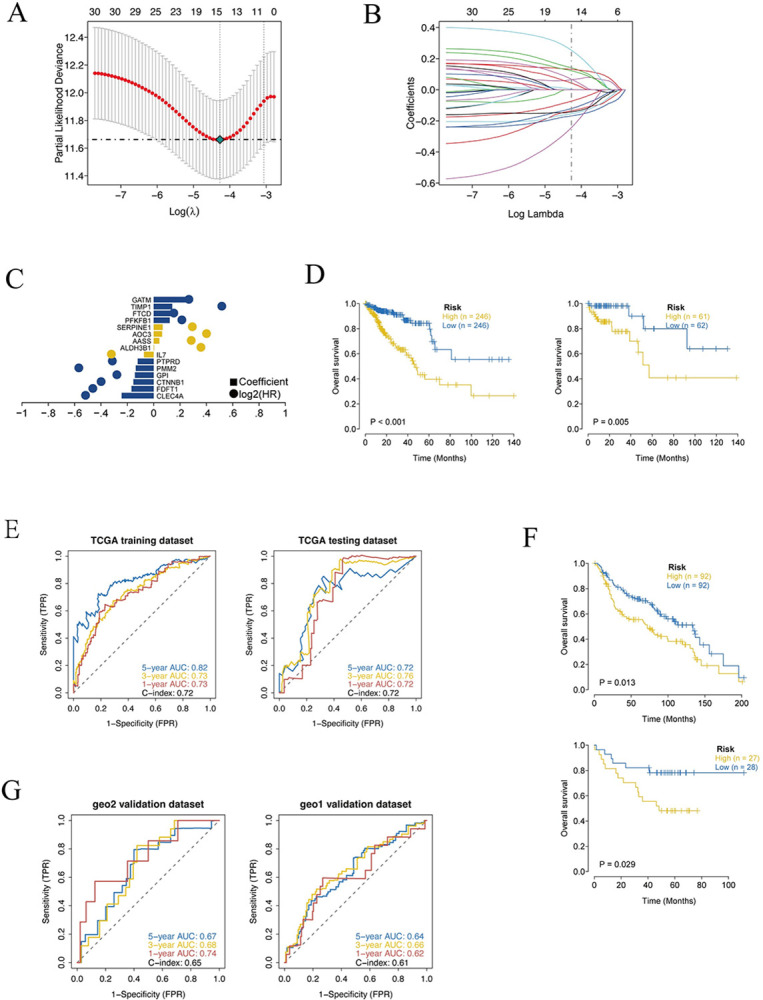
Fig 2. Prognostic model of fructose metabolism genes in colorectal cancer.

(A) Ten cross-validations of tuning parameter selection in the LASSO model to determine the minimum lambda value. (B) LASSO coefficient distribution of prognostic genes and gene combinations at the minimum lambda value. (C) Coefficient of the Lasso gene. (D) Survival curves for TCGA training set and test set models. (E) ROC curves (years 1-3-5) for the TCGA training set model and the test set model. (F) Survival curve of GEO external dataset model, the survival curve of patients in high risk group was significantly lower than that in low risk group. (G) ROC curves for GEO external dataset models (years 1-3-5).
