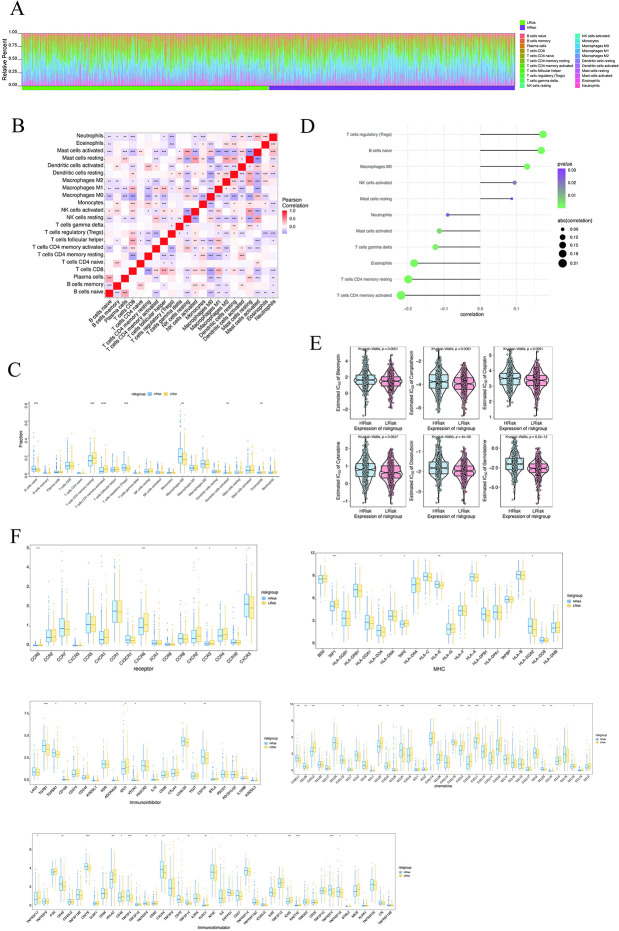
Fig 3. Multi-omics study to investigate the clinical predictive value of the model.
(A) Relative percentages of 22 immune cell subsets in high-risk and low-risk patients. (B) Pearson correlation between 22 immune cells, blue indicates positive correlation and red indicates positive correlation. (C) Differences in immune cell content between high-risk and low-risk patients, with blue indicating low-risk patients and yellow indicating high-risk patients. (D) Association of risk score with immune cells. (E) Sensitivity analysis of risk score versus common chemotherapeutic agents. (F) Differential expression of chemokines, immunostimulants, MHC, receptors, and immunosuppressive agents between patients in the high- and low-risk groups, with blue indicating low-risk patients and yellow indicating high-risk patients.

