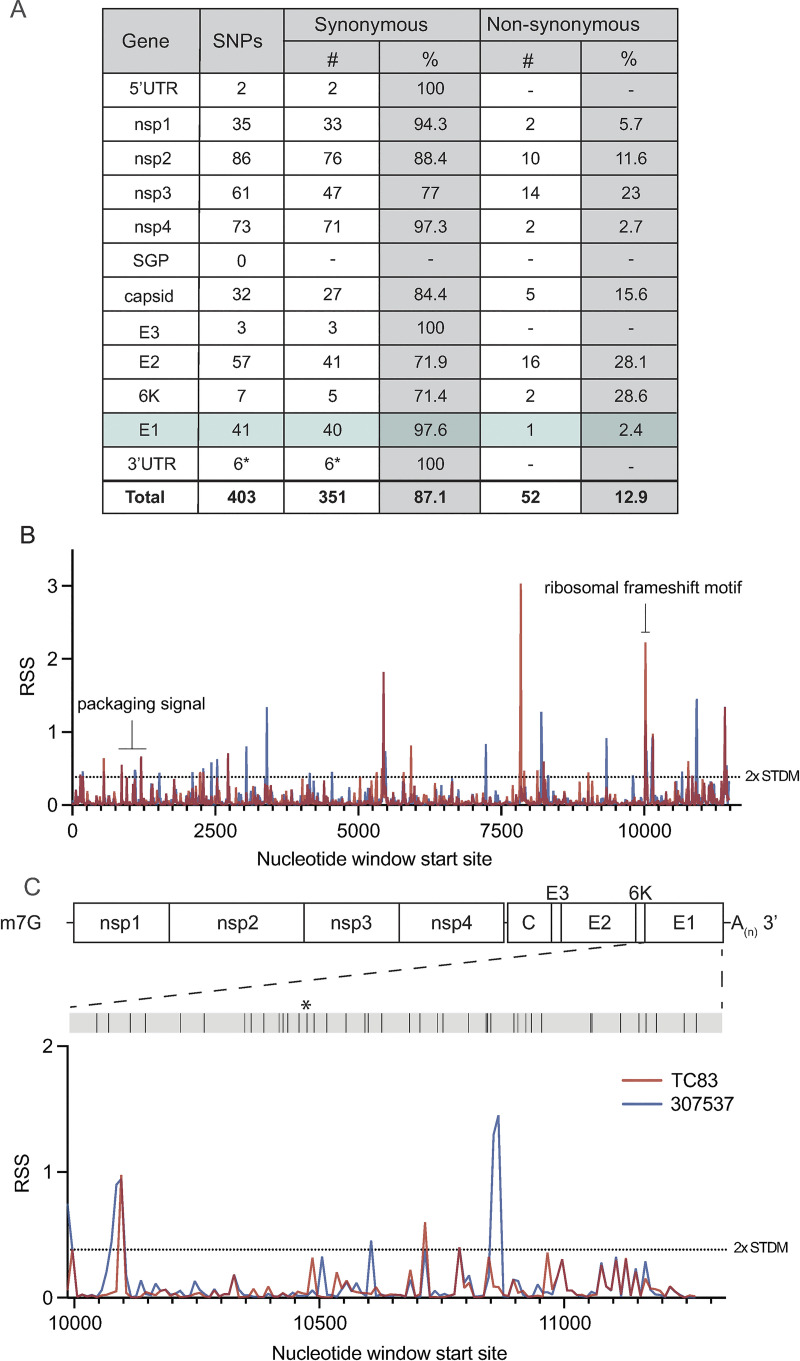
Fig 1. Predicted RNA secondary structure of E1 differs between epizootic and enzootic VEEV.
(A) Summary of all SNPs identified between TC83 and 307537. (B) RNA structure analysis of subtype IAB and ID VEEV. RNA structure prediction of VEEV strain TC83 (IAB; accession L01443) and strain 307537 (ID; accession KC344519) was performed using RNAfold [17] (window size = 50nt, step size = 10 nt). The RNA structure score (RSS; frequency of MFE/ensemble diversity) is plotted against the nt window start site. Higher RSS indicates greater thermodynamic stability of predicted structures. The 2-fold standard deviation is indicated by a dotted line. (C) RSS analysis of gene E1 from strains TC83 and 307537. Location of all SNPs across E1, including a single coding change (*), are depicted in the grey bar above.

