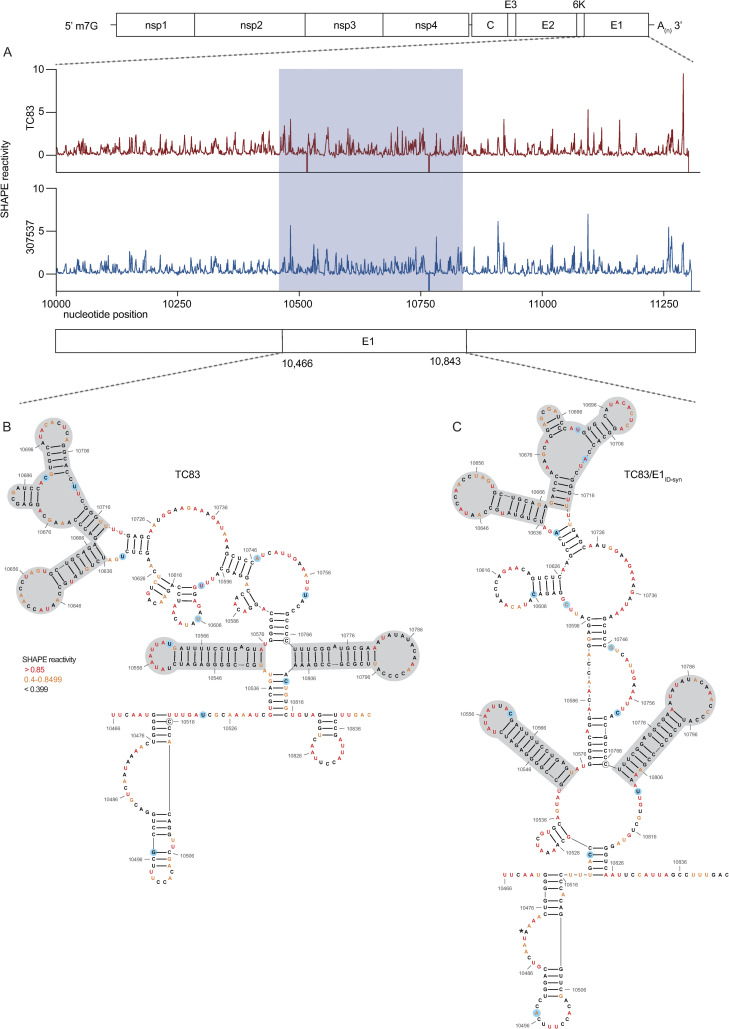
Fig 7. SHAPE-MaP analysis of TC83 and TC83/E1IDsyn infected cells.
RNA from Vero cells infected with TC83 or TC83/E1IDsyn (MOI of 0.1) was analyzed by SHAPE-MaP. (A) Differential SHAPE reactivities of nucleotides in E1. The central region responsible for enhanced macrophage replication of TC83/E1IDsyn is highlighted in blue. Secondary structures and SHAPE reactivities of nucleotides in the central domain of (B) TC83 and (C) TC83/E1IDsyn. Low reactive nucleotides (black) correspond to base-paired nucleotides and highly reactive nucleotides (orange, red) correspond to exposed bases. Structural elements conserved between both viruses are highlighted in grey, and SNPs are highlighted in blue.

