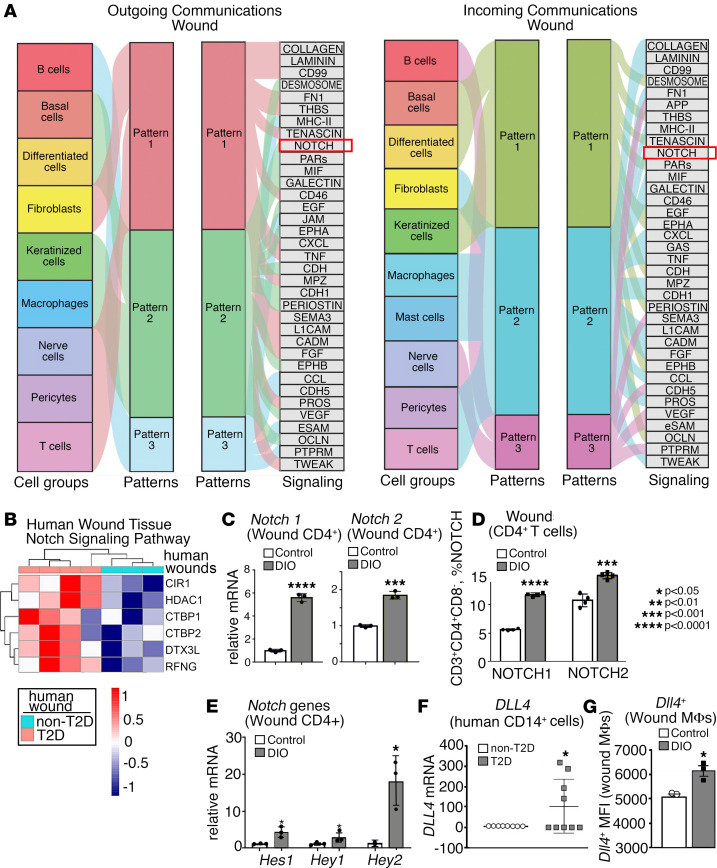
Figure 2. Notch signaling is increased in human and murine diabetic wound CD4+ Th cells.
(A) River plots depicting cell groups and ligand-receptor pairs affect outgoing (signal source) and incoming (signal responder) pattern. The thickness of the flow indicates the contribution of the cell group or signaling pathway to each latent pattern (n = 10). (B) Human bulk RNA-Seq heatmap reflecting the expression profiles for selective genes (rows) across different samples (columns; stratified by T2D status) from Gene Ontology pathway analysis with upregulation of Notch signaling in T2D wounds compared with control wounds (n = 7). (C) Notch receptor expression in wound CD4+ Th cells 7 days after wounding between diet-induced obesity (DIO) mice and their normal diet, nondiabetic littermate controls (n = 6 mice/group, run in triplicate). (D) Analytical flow cytometry of wound cell suspensions 5 days after wounding between ND (n = 4) and DIO (n = 4) mice, evaluating for Lin–/CD3+/CD4+/Notch1+ (or Lin–/CD3+/CD4+/Notch2+). (E) Hes1, Hey1, and Hey2 expression in wound CD4+ Th cells 5 days after wounding between ND and DIO mice (n = 6 mice/group, run in triplicate). (F) DLL4 expression in peripheral human CD14+ monocytes between nondiabetic (n = 8) and diabetic (n = 9) donors. (G) Analytical flow cytometry between ND (n = 3) and DIO (n = 3) wound Mφs evaluating for Lin−/Ly6G−/CD11b+/DLL4+. *P < 0.05, ***P < 0.001, ****P < 0.0001. Data are presented as the mean ± SEM. Data were first analyzed for normal distribution, and if data passed the normality test, 2-tailed Student’s t test was used.

