FIGURE 1.

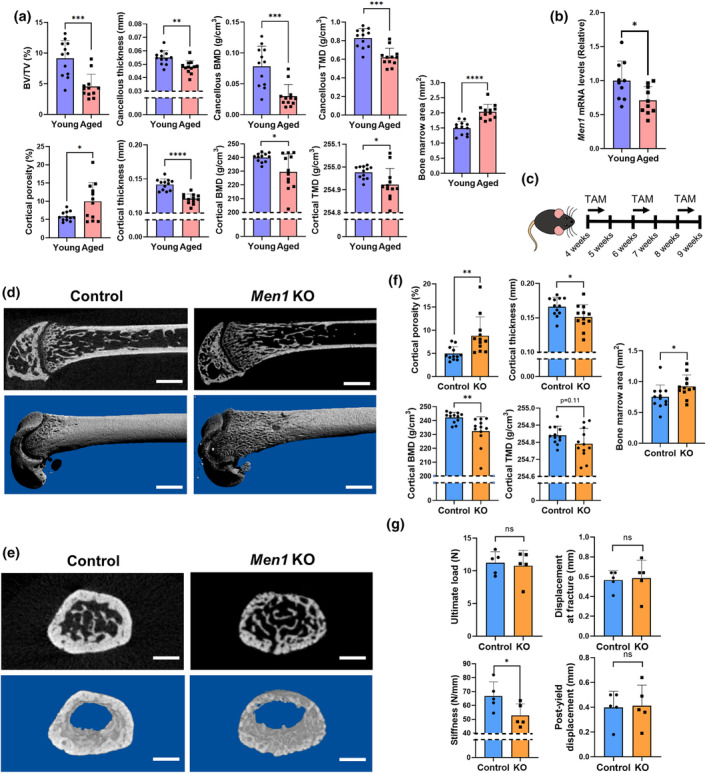
Structural analysis of bones in the trunk. (a) Micro‐computed tomography (μCT) analysis of the femur of wild‐type 2‐month‐old (young, n = 12) and 24‐month‐old (aged, n = 12) mice, including bone volume (BV)/tissue volume (TV), cancellous thickness, cancellous bone mineral density (BMD), cancellous tissue mineral density (TMD), cortical porosity, cortical thickness, cortical BMD, cortical TMD, and bone marrow area. (b) Relative Men1 mRNA levels to young mice in the spine bone. Young mice (n = 10), aged mice (n = 10). (c) Experimental design for deleting the Men1 gene of osteoblasts. Men1 flox/flox mice (Control) and Men1 flox/flox; Col1a1‐cre/ERT2 mice (Men1 KO) received tamoxifen (TAM) treatment at 10 mg/kg/day for 4 days at 4, 6, and 8 weeks of age. Mice were euthanized and analyzed at 9 weeks of age. (d) Representative μCT sagittal images of the Control and Men1 KO femur from 9‐week‐old mice. Upper: two‐dimensional image; lower: three‐dimensional reconstructed image. Scale bars, 1 mm. (e) Representative μCT axial images of the Control and Men1 KO femur from 9‐week‐old‐ mice at 1.5 mm proximal to the distal growth plate. Upper: two‐dimensional image; lower: three‐dimensional cortical bone image. Scale bars, 1 mm. (f) Micro‐CT analysis of the femur of 9‐week‐old Control (n = 12) and Men1 KO (n = 12) mice, including cortical porosity, cortical thickness, cortical BMD, cortical TMD, and bone marrow area. (g) Result of biomechanical testing in 9‐week‐old Control (n = 5) and Men1 KO (n = 5) mice, including ultimate load, displacement at fracture, stiffness, and post‐yield displacement. Data represent mean ± SD (error bars). *p < 0.05, **p < 0.01, ***p < 0.001, ****p < 0.0001 by two‐tailed Student's t‐test (unpaired). ns, not statistically significant.
