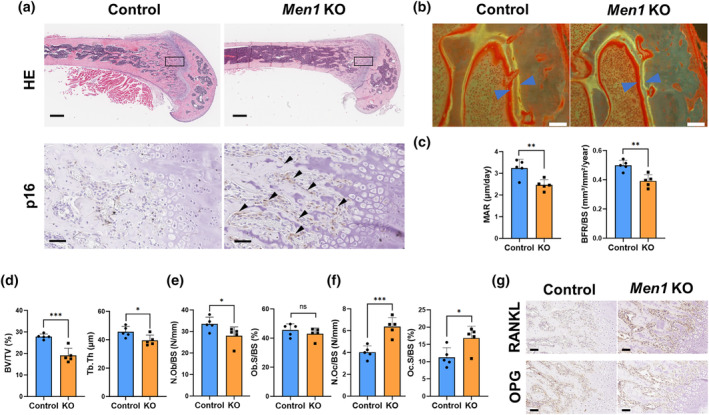
FIGURE 2.

Histological characteristics of Men1‐deficient bones. (a) Representative histological images of the femur bone from 9‐week‐old Men1 flox/flox (Control) mice and Men1 flox/flox; Col1a1‐cre/ERT2 (Men1 KO) mice. Hematoxylin and eosin staining (HE) and p16 immunostaining. Lower panels are enlarged images of the rectangular area of the upper image. Arrows indicate p16‐positive cells. Scale bars, 500 μm (upper) and 50 μm (lower). (b) Representative fluorescent images of the femur from 9‐week‐old Control and Men1 KO mice. Scale bars, 50 μm. Arrows indicate the space between the double‐stained lines. (c) Histomorphometric parameters of bone formation in 9‐week‐old Control (n = 5) and Men1 KO (n = 5) mice, including mineral apposition rate (MAR) and bone formation rate (BFR)/bone surface (BS). (d) Histomorphometric parameters of bone structure in 9‐week‐old Control (n = 5) and Men1 KO (n = 5) mice, including bone volume (BV)/tissue volume (TV) ratio and trabecular thickness (Tb.Th). (e) Histomorphometric parameters of osteoblasts in 9‐week‐old Control (n = 5) and Men1 KO (n = 5) mice, including number of osteoblasts (N.Ob)/BS and osteoblast surface (Ob.S)/BS. (f) Histomorphometric parameters of osteoclasts in 9‐week‐old Control (n = 5) and Men1 KO (n = 5) mice, including number of osteoclasts (N.Oc)/BS and osteoclast surface (Oc.S)/BS. (g) Representative RANKL, OPG immunostaining images of the femur bone from 9‐week‐old Control and Men1 KO mice. Scale bars, 50 μm. Data represent mean ± SD (error bars). *p < 0.05, **p < 0.01, ***p < 0.001 by two‐tailed Student's t‐test (unpaired). ns, not statistically significant.
