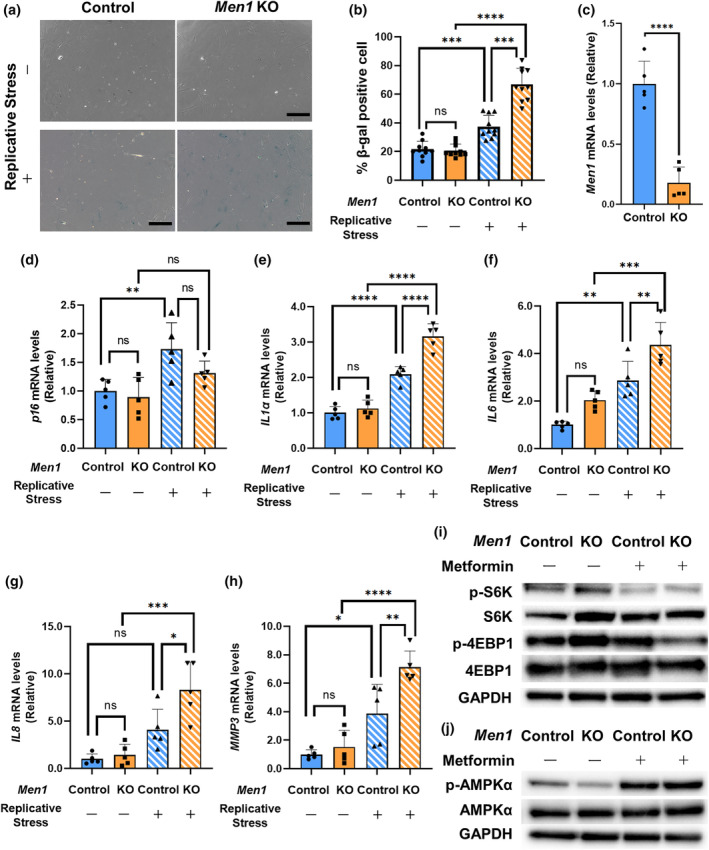
FIGURE 3.

Osteoblast senescence induced by Men1 deficiency in vitro. (a) Senescence‐associated galactosidase (SA β‐Gal) staining of osteoblasts from the Men1 flox/flox murine mice calvaria. Osteoblasts were infected with eGFP adenovirus (Ad‐GFP, Control) and Cre recombinase adenovirus (Ad‐Cre‐GFP, Men1 KO). Passage (P) 3 (replicative stress: −) and P6 (Replicative stress: +) cells were used for the experiments. Scale bars, 250 μm. (b) Quantitative evaluation of β‐Gal‐positive cells in Control (n = 10 fields) and Men1 KO (n = 10 fields) mice. (c) Relative mRNA levels of Men1 to Control osteoblasts (Replicative stress: −). Control osteoblasts (Replicative stress: −), n = 5; Men1 KO osteoblasts (Replicative stress: −), n = 5. (d–h) Relative mRNA levels of p16, IL1α, IL6, IL8, and MMP3 to Control osteoblasts (Replicative stress: −). Control osteoblasts (Replicative stress: −) (n = 5), Men1 KO osteoblasts (Replicative stress: −) (n = 5), Control osteoblasts (Replicative stress: +) (n = 5), and Men1 KO osteoblasts (Replicative stress: +) (n = 5). (i) Immunoblotting to evaluate the expression of factors downstream of mTORC1. (j) Immunoblotting of AMPKα in control osteoblasts (Replicative stress: −), Men1 KO osteoblasts (Replicative stress: −), Control osteoblasts (Replicative stress: +), and Men1 KO osteoblasts (Replicative stress: +). Data represent mean ± SD (error bars). *p < 0.05, **p < 0.01, ***p < 0.001, ****p < 0.0001 by two‐tailed Student's t‐test (unpaired) (c), one‐way ANOVA followed by Sidak's test (b, d–h). ns, not statistically significant.
