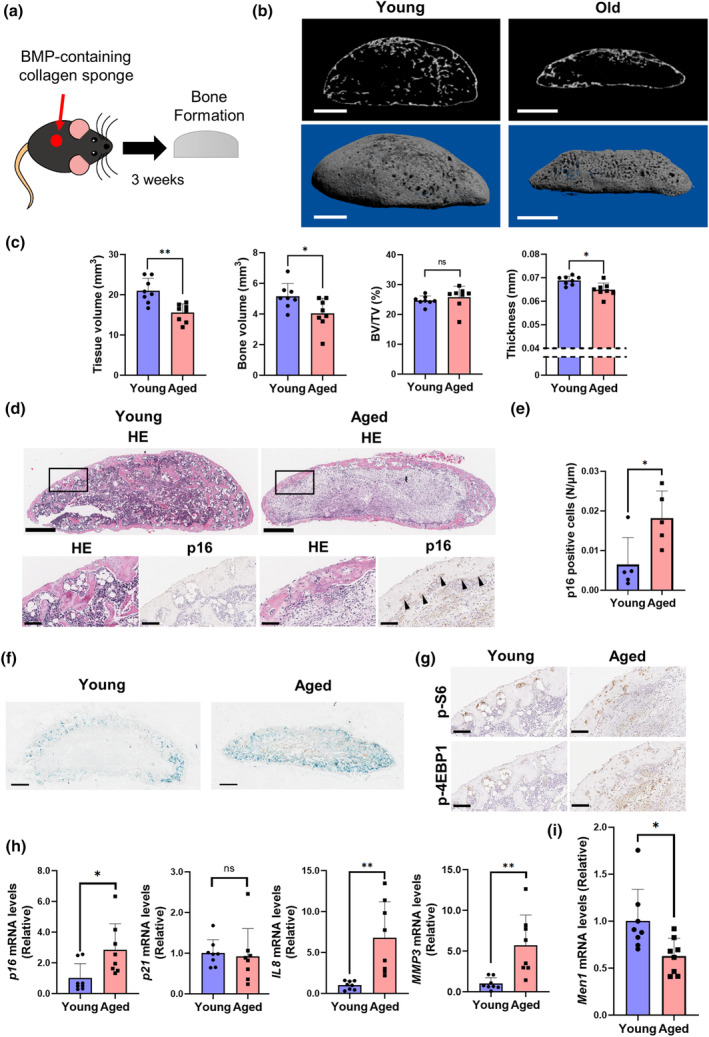
FIGURE 4.

Senescent bone formation in natural aging. (a) Schema of establishment of the ectopic bone formation model. A BMP‐containing collagen sponge was set underneath the fascia of 2‐month‐old (young) and 24‐month‐old mice (aged) mice. After 3 weeks, the formed ectopic bone was evaluated. (b) Representative μCT sagittal images of the ectopic bone. Scale bars, 1 mm. (c) Micro‐CT analysis of the ectopic bone in young (n = 8) and aged (n = 8) mice, including tissue volume (TV), bone volume (BV), BV/TV, and thickness. (d) Representative histological images of the ectopic bone in young and aged mice. Hematoxylin and eosin staining (HE) and p16 immunostaining. Lower panels are enlarged images of the rectangular area of upper panels. Arrows indicate p16‐positive cells. Scale bars, 500 μm (upper) and 100 μm (lower). (e) Quantitative evaluation of p16‐positive cells in young (n = 5) and aged (n = 5) mice. (f) Representative beta‐galactosidase staining images of the ectopic bone in young and aged mice. Scale bars, 500 μm. (g) Representative histological images of the ectopic bone in young and aged mice. p‐S6 and p‐4EBP1 immunostaining. Scale bars, 100 μm. (h) Relative mRNA levels of p16, p21, IL1α, IL8, and MMP3 to young mice. Young mice (n = 8) and aged mice (n = 8). (i) Relative Men1 mRNA levels to young mice. Young mice (n = 8) and aged mice (n = 8). *p < 0.05, **p < 0.01 by two‐tailed Student's t‐test (unpaired). Data represent mean ± SD (error bars). ns, not statistically significant.
