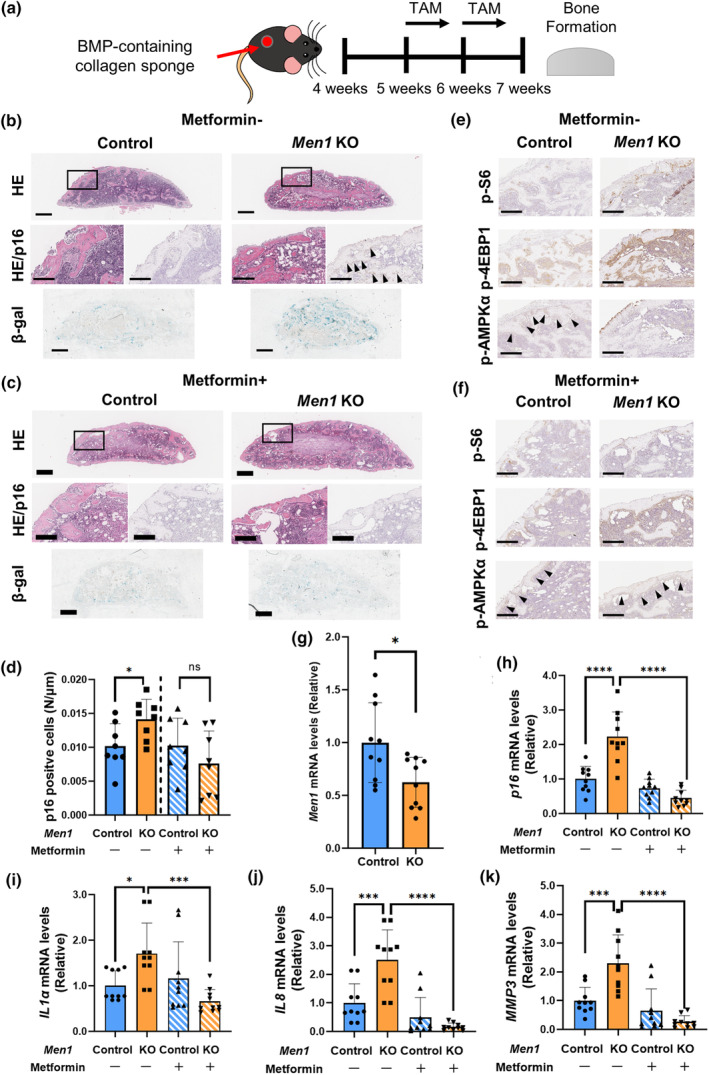
FIGURE 5.

Characteristics of Men1 knockout bone formation. (a) Schema of the ectopic bone formation model of Men1 flox/flox (Control) and Men1 flox/flox; Col1a1‐cre/ERT2 (Men1 KO) mice. (b) Representative histological images of Control and Men1 KO ectopic bone without metformin administration from 7‐week‐old mice. Hematoxylin and eosin staining (HE), p16 immunostaining, and beta‐galactosidase (β‐Gal) staining. Second (HE, p16) images are enlarged images of the rectangular area of the first (HE) images. Arrows indicate p16‐positive cells. Scale bars, 500 μm (first, third images) and 200 μm (second images). (c) Representative histological images of Control and Men1 KO ectopic bone with metformin administration from 7‐week‐old mice. HE, p16 immunostaining, and β‐Gal staining. Second (HE, p16) images are enlarged images of the rectangular area of the first (HE) images. Scale bars, 500 μm (first, third images) and 200 μm (second images). (d) Quantitative evaluation of p16‐positive cells relative to Control bone (metformin: −) (n = 8) in Control bone (metformin: −) (n = 8), Men1 KO bone (metformin: −) (n = 8), Control bone (metformin: +) (n = 8), and Men1 KO bone (metformin: +) (n = 8) from 7‐week‐old mice. (e) Representative immunostaining images for p‐S6, p‐4EBP1, and p‐AMPKα of Control and Men1 KO ectopic bone without metformin administration from 7‐week‐old mice. Arrows indicate p‐AMPKα positive cells. Scale bars, 200 μm. (f) Representative immunostaining images for p‐S6, p‐4EBP1, and p‐AMPKα of Control and Men1 KO ectopic bone with metformin administration from 7‐week‐old mice. Arrows indicate p‐AMPKα positive cells. Scale bars, 200 μm. (g) Relative mRNA levels of Men1 to Control bone (metformin: −) in Control bone (metformin: −) (n = 10), Men1 KO bone (metformin: −) (n = 10) from 7‐week‐old mice. (h–k) Relative mRNA levels of p16, IL1α, IL8, and MMP3 to Control bone (metformin: −) in Control bone (metformin: −) (n = 10), Men1 KO bone (metformin: −) (n = 10), Control bone (metformin: +) (n = 10), and Men1 KO bone (metformin: +) (n = 10) from 7‐week‐old mice. Data represent mean ± SD (error bars). *p < 0.05, ***p < 0.001, ****p < 0.0001 by two‐tailed Student's t‐test (unpaired) (d, g), one‐way ANOVA followed by Sidak's test (h–k). ns, not statistically significant.
