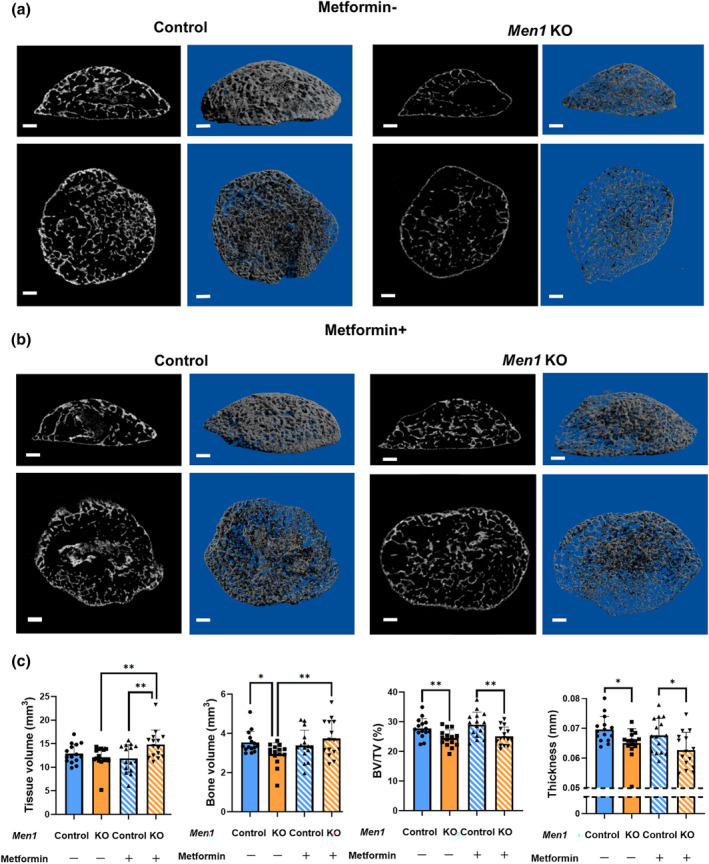
FIGURE 6.

Miro‐computed tomography (μCT) analysis of ectopic bone with osteoblast senescence. (a) Representative μCT images of the ectopic bone of Men1 flox/flox (Control) and Men1 flox/flox; Col1a1‐cre/ERT2 (Men1 KO) mice without metformin administration from 7‐week‐old mice. Sagittal (upper) and coronal (lower) images. Two‐dimensional images (left) and three‐dimensional reconstructed images (right). Scale bars, 500 μm. (b) Representative μCT images of the ectopic bone of Control and Men1 KO mice with metformin administration from 7‐week‐old mice. Sagittal (upper) and coronal (lower) images. Two‐dimensional images (left) and three‐dimensional reconstructed images (right). Scale bars, 500 μm. (c) Micro‐CT analysis of the ectopic bone in Control (metformin: −) (n = 15), Men1 KO (metformin: −) (n = 15), Control bone (metformin: +) (n = 15), and Men1 KO (metformin: +) (n = 15) mice from 7‐week‐old mice, including tissue volume (TV), bone volume (BV), BV/TV, and thickness. Data represent mean ± SD (error bars). *p < 0.05, **p < 0.01 by one‐way ANOVA followed by Fisher's LDS test.
