
FIGURE 2.
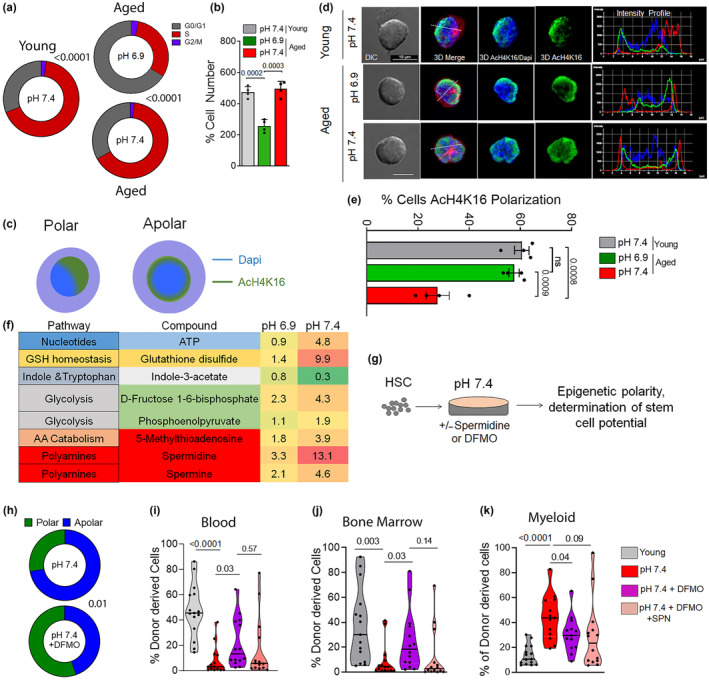
Changes in epigenetic polarity and low levels of polyamines are linked to the rejuvenation of HSCs by pH 6.9. (a) Percentage of cells in the G1, S and G2/M phase of the cell cycle upon exposure to pH 7.4 or pH 6.9. n = 4 biological replicates, exact p‐values are mentioned between marked group; two‐tailed unpaired Student's t‐test. (b) Percentage of the cell number post‐exposure/cultivation for 40 h relative to the total input of HSCs. n = 4 biological replicates, exact p‐values are mentioned between marked group; two‐tailed unpaired Student's t‐test. (c) Graphical representation of a polar and apolar distribution of proteins (Tubulin, AcH4K16) within an HSC. (d) Representative immunofluorescence pictures of pH 6.9 and pH 7.4 HSCs stained with anti‐AcH4K16 (green), anti‐tubulin (red), and nuclei stained with DAPI (blue), including the determination of an intensity profile through the cell. Pictures are shown as individual color images that are a 3D reconstruction of a Z‐stack capture and the overlay of color pictures and the overlay with DICs. Bar = 10 μm. (e) Percentage of pH 7.4 and pH 6.9 HSCs polarized for AcH4K16 compared to young controls. n = 4 biological replicates, exact p‐values are mentioned between marked group; two‐tailed unpaired Student's t‐test. (f) Table representing pathways and median changes in metabolites in HSCs at pH 6.9 and pH 7.4 relative to untreated (fresh) cells. n = 3 biological replicates. (g) Experimental set‐up for determining epigenetic polarity and reconstitution potential of HSCs upon modulation of the polyamine pathway by DFMO and DFMO/Spermidine (SPN) treatment. (h) Percentage of aged HSCs polarized for AcH4K16 in response to treatment with DFMO at pH 7.4, at least 50 cells per replicate, n = 2 biological replicates. Exact p‐values are mentioned between marked group; two‐tailed unpaired Student's t‐test). (i, j) Percentage of donor‐derived Ly5.2+ hematopoietic cells in peripheral blood (i) and BM (j) in animals transplanted with 100 HSCs (young or cultured at pH 7.4, in the presence of DFMO or in combination with SPN. Data in Figures (i, j) are from n = 12–16 recipient mice from two independent biological transplantation experiments. p‐values within the figure; two‐tailed unpaired Student's t‐test. (k) Contribution of myeloid cells among donor‐derived Ly5.2+ cells in PB. Exact p‐values are mentioned between marked group; two‐tailed unpaired Student's t‐test. All data are mean ± SE except violin plots.