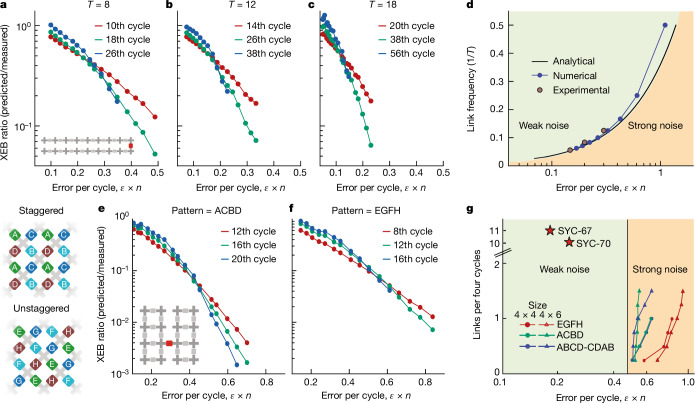
Fig. 3. Noise-induced phase transitions.
a–c, Experimental noise-induced phase transitions as a function of the error per cycle for several periods T of the weak-link model (discrete gate set) (T = 8 (a), T = 12 (b) and T = 18 (c)). As T increases, the critical value of noise or error per cycle becomes lower. d, Phase diagram of the transition with analytical, numerical and experimental data. The experimental data were extracted from the crossing of the largest number of cycles scanned. e,f, Experimental transitions in two dimensions with different patterns: staggered ACBD (e) and unstaggered EGFH (f; discrete gate set). g, Numerical phase diagram of the two-dimensional phase transition. We show the critical point for different sizes and patterns. The qubits are arranged as shown in the inset of e. For fixed size, we increased the number of bridges (such as the red coupler in e) until all bridges were applied (four and six for the 4 × 4 and 4 × 6 systems, respectively), denoted as links per four cycles in g. For all the patterns, we delimited a lower bound on the critical error rate of 0.47 errors per cycle to separate the region of strong noise where XEB failed to characterize the underlying fidelity and where global correlations were subdominant. The experimental results shown in Fig. 4 (SYC-67) and in Supplementary Information section C1 (SYC-70) are represented by red stars, which are well within the weak-noise regime.

