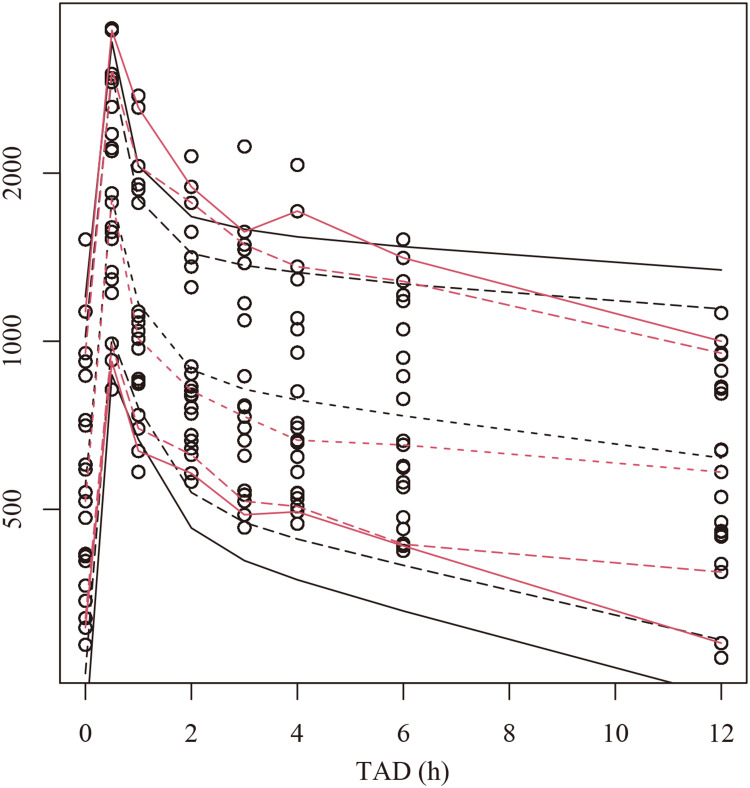
Figure 2.
Visual predictive check (VPC) plots for the plasma tigecycline concentration. The Y-axis is the logarithm of the concentration. The open circles represent the observed concentrations. The hollow circles represent the observations. Observed (red lines) and predicted (black lines) 5th, 10th, 50th, 90th and 95th percentiles.

