Fig. 2.


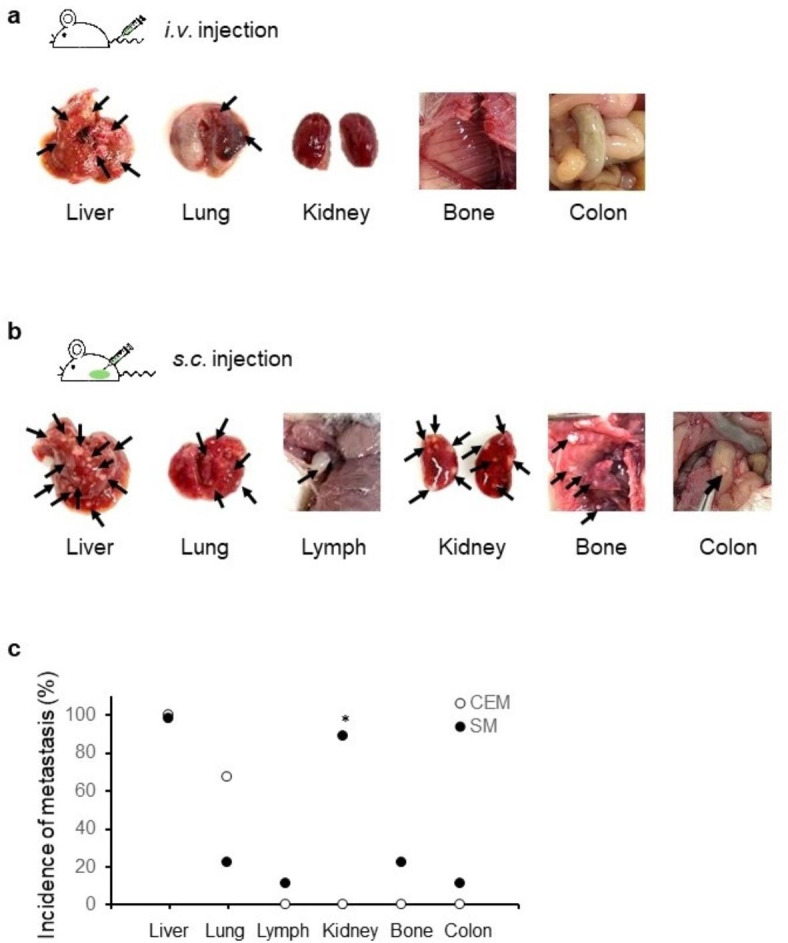
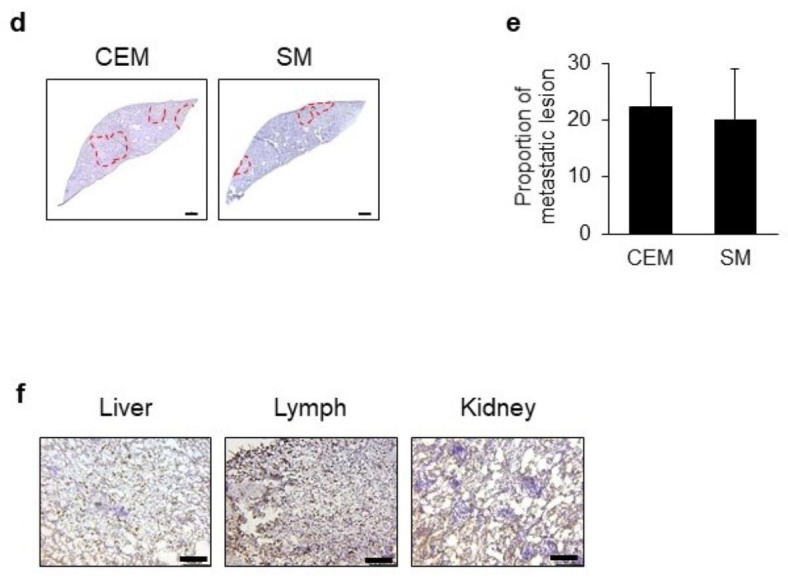
Comparison of metastatic lesions between intravenous (i.v.) and subcutaneous (s.c.) transplantation. (a) Metastatic lesions in the conventional experimental metastasis model. SK-Hep-1 cells were intravenously transplanted into NSG mice (n = 5). (b) Metastatic lesions in the spontaneous metastatic xenograft model. SK-Hep-1 cells were subcutaneously implanted into NSG mice (n = 5). Black arrow, metastatic lesion. (c) Comparison of metastatic lesions between two metastatic models in NSG mice. Data are expressed as the proportion of mice with metastases to multiple organs compared with the entire experimental group (Fisher’s exact test). *, p < 0.05. CEM, Conventional experimental metastasis model; SM, spontaneous metastasis model. (d) Hematoxylin-stained liver tissues. The red dashed lines indicate the metastatic lesions. CEM, Conventional experimental metastasis model; SM, spontaneous metastasis model. Scale bar, 500 μm. (e) Quantification of metastatic lesion in liver tissues. Data are expressed as the mean ± standard deviation (n = 3 / group). (f) Expression of Ki67 in metastatic lesions of organs (liver, lymph nodes, kidneys) in the spontaneous metastasis model. Scale bar, 100 μm.
