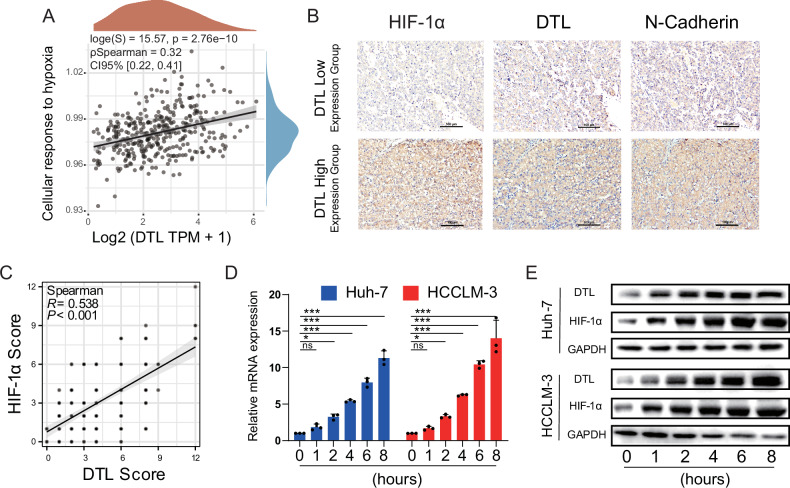
Fig. 2. DTL expression was positively correlated with hypoxia.
A The correlation between DTL and cellular response to the hypoxia pathway was analyzed with Spearman. B Representative IHC staining of HIF-1α, DTL, and N-cadherin in DTL-high and DTL-low HCC tissue. C Correlation analysis between the IHC score of DTL and HIF-1α (n = 209). D The mRNA levels of DTL at different hypoxia time points. E Protein expression of DTL and HIF-1α at different time points. *P < 0.05, ***P < 0.001, ns no significance.

