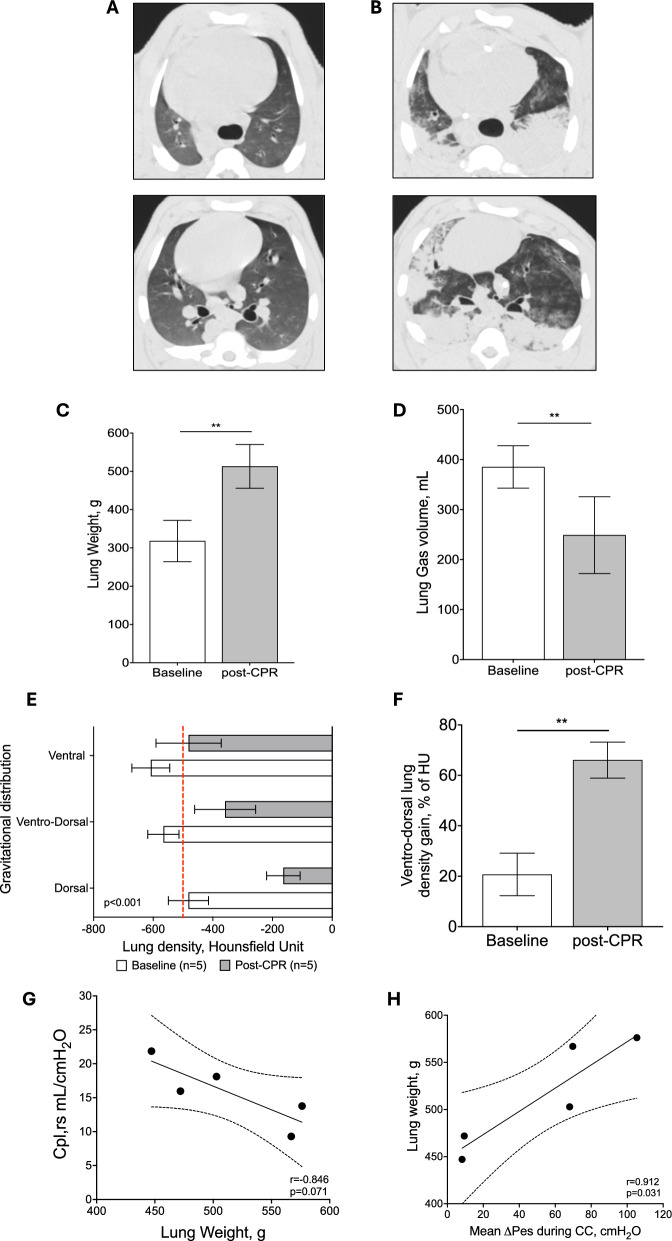
Fig. 4.
Quantitative computed tomography analyses at baseline and post-CPR. Representative axial scan images at two different levels (upper and lower) of the lungs at baseline (panel A) and post-CPR (panel B). Lung weight and lung gas volume at baseline and post-CPR (panel C and D). Lung gravitational distribution stratified in three different areas (i.e., ventral, ventro-dorsa, and dorsal) at baseline and post-CPR condition (panel E). The red dashed-line refers to the density threshold commonly used to separate the normally (density < −500 HU) versus poorly (density > −500 HU) aerated lung areas. In panel F, the gravitational change in ventro-dorsal lung density expressed as HU%. Association of lung weight with Cpl,rs (G) and mean Pes during CC and lung weight (H). In G and H, the continuous line represents the best fit line of the linear regression with the 95% confidence interval represented with dashed lines

