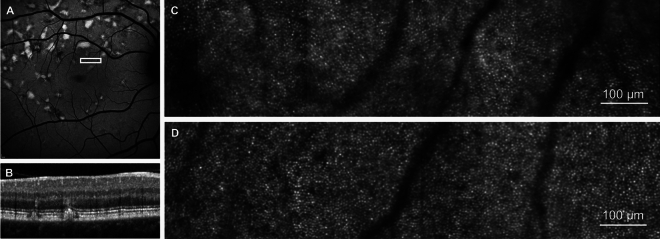
Fig. 1.
Photoreceptor mosaic in Stargardt disease in an area of near normal retina. (A) 30° short-wavelength fundus autofluorescence image, white box represents the retinal area corresponding to the photoreceptor mosaic in C and retinal cross section in B. (B) Spectral-domain optical coherence tomography of the retinal region represented by the white box in A. (C) Photoreceptor mosaic of participant S04. (D) Photoreceptor mosaic of an age-matched control (C05) to participant S04 from the same retinal eccentricity.

