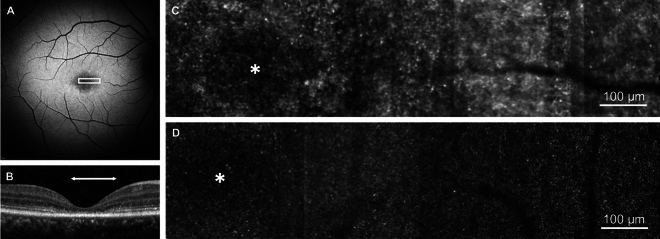
Fig. 2.
Photoreceptor mosaic in Stargardt disease in an area of degenerated retina. (A) 30° short-wavelength fundus autofluorescence image, white box represents the retinal area corresponding to the photoreceptor mosaic in C. (B) Spectral-domain optical coherence tomography. The horizontal white arrow indicates the retinal area that corresponds to the white box in A. (C) Photoreceptor mosaic of participant S06. (D) Photoreceptor mosaic of an age-matched control (C02) to participant S06 from the same retinal eccentricity. Asterisk represents the foveal centre.

