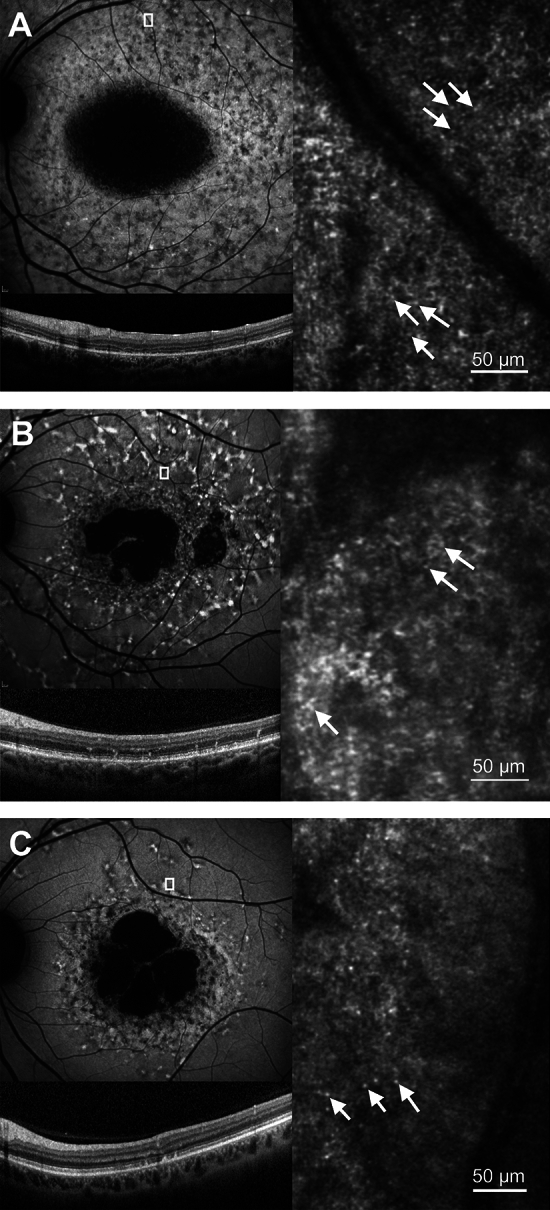
Fig. 4.

Examples of discrete hyper-reflective foci. 30° short-wavelength fundus autofluorescence (upper left), spectral-domain optical coherence tomography (lower left) and confocal AOSLO (right) images are shown. The white box in the short- wavelength fundus autofluorescence image represents the retinal area corresponding to the photoreceptor mosaic. White arrows indicate examples of the discrete hyper-reflective foci that can be seen throughout each image. (A) participant S11, (B) participant S14, (C) participant S15.
