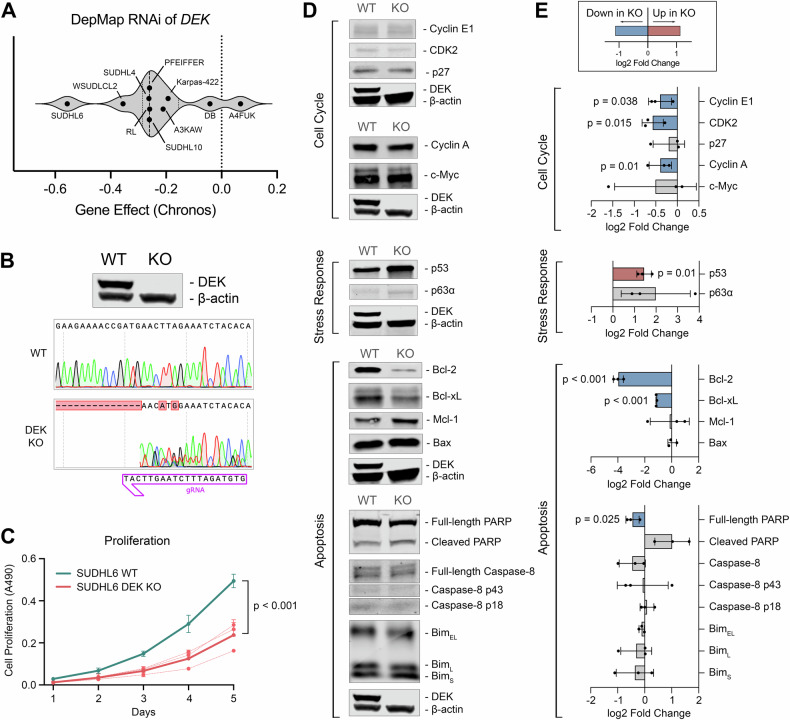
Fig. 3. DEK depletion inhibits proliferation and is accompanied by reduced expression of cell cycle genes, reduced Bcl-2 and Bcl-xL expression, and increased p53 expression.
A Chronos Gene Effect from RNAi of DEK in B-cell lymphoma cell lines. Gene effect represents the impact of DEK RNAi on cellular fitness, with negative values representing a negative impact to cellular fitness. B Validation of DEK knockout by western blot and Sanger sequencing. C In vitro five-day proliferation assay of synchronized SUDHL6 WT versus DEK KO cells. Proliferation was measured by MTT assay with n = 3 biological replicates. Assays were run with technical triplicates. D Western blot analysis of cell cycle, apoptosis, and stress response proteins in SUDHL6 WT and DEK KO cells. Cell lines were harvested at ≥ 95% viability. Blots have been cropped to display indicated proteins based on molecular weight. The corresponding DEK and β-actin controls were processed in parallel and are displayed below their corresponding samples. E Quantifications of protein expression in DEK KO versus WT cells of n = 3 biological replicates. All quantifications were scaled to β-actin levels and fold-changes of DEK KO versus WT were used as input for statistical analysis. Plots depict the mean and SD of log2 fold change values, where negative values represent reduced expression in DEK KO. Blue bars indicate a statistically significant decrease of expression in DEK KO cells, red bars indicate a statistically significant increase in DEK KO cells.

