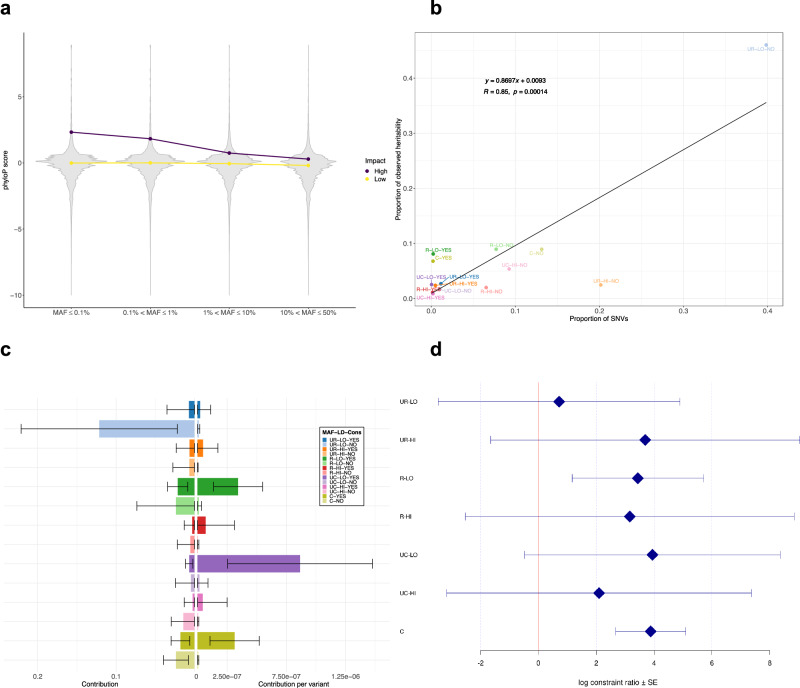
Fig. 2. Distribution of phyloP scores and contribution of constrained SNVs to CAD heritability.
a Violin plots of phyloP scores against the four MAF bins stratified by SnpEff predicted impact (High: protein-altering variants, Low: non-protein-altering variants). Points indicate medians of phyloP scores in each MAF bin. For ease of presentation, SNVs with phyloP score < −10 are omitted. b Proportion of observed heritability in each LD score-MAF-Constrained bin against the proportion of SNVs in that bin (number of SNVs in the bin divided by the total number of SNVs). Each label in the plot represents a combination of: i) MAF (UR: ultra-rare (MAF ≤ 0.1%), R: rare (0.1% < MAF ≤ 1%), UC: uncommon (1% < MAF ≤ 10%), C: common (10% < MAF ≤ 50%)); ii) LD score (LO: low, HI: high); and iii) Constrained (YES or NO). The black line shows the regression line, whose equation is displayed in the upper left corner (n = 14). R designates the Pearson correlation coefficient, while p is the p-value associated with the two-sided test of null correlation. c Absolute (left) and relative (right) contribution per variant of each LD score-MAF-Constrained bin to the global CAD heritability estimate. The legend and color-coding is the same as in (b). Error bars represent ± one SE from each contribution point estimate. Absolute SEs (left) are calculated by GCTA and are proportional to the effective number of independent variants in each bin and inversely proportional to the total sample size (4949 cases + 17,494 controls). Relative SEs (right) are obtained by dividing the corresponding absolute SEs by the square root of the number of variants. d Log constraint ratio of constrained over non-constrained variants in each LD score-MAF bin. Each label on the y-axis is defined as in (b). Error bars represent ± one SE from each log constrain ratio estimate. SEs are calculated from GCTA’s output of the covariance matrix of contribution estimates to heritability in each bin and their corresponding number of SNVs (see Supplementary “Methods” for derivation details). CAD, coronary artery disease; Cons, constrained; LD, linkage disequilibrium; MAF, minor allele frequency; SE, standard error; SNV, single nucleotide variant.

