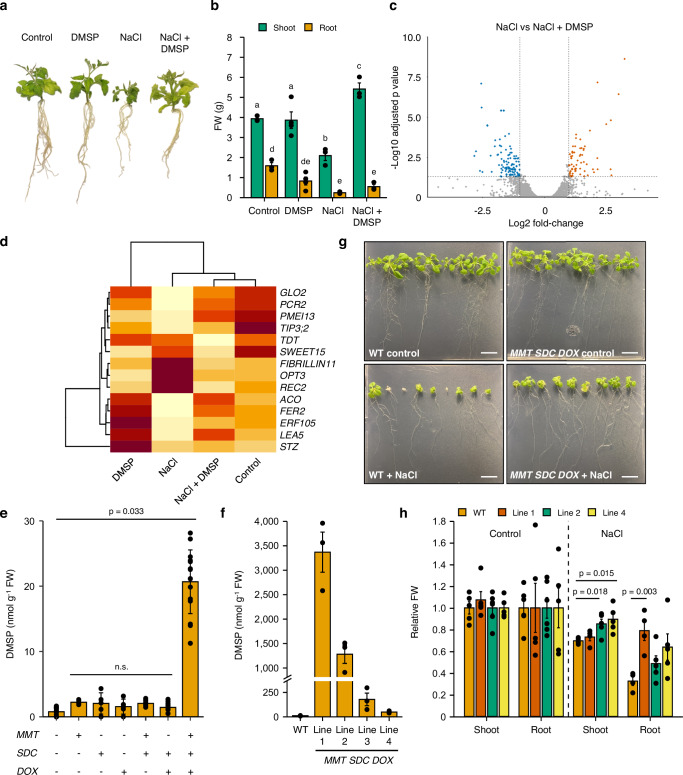
Fig. 4. DMSP protects plants from abiotic stress.
a Image of representative tomato plants from each treatment group, demonstrating that biomass loss caused by NaCl is rescued by DMSP treatment. b Fresh weight measurements of tomato plants from each treatment group, demonstrating that biomass loss caused by NaCl is rescued by DMSP treatment (n = 9, p < 0.05 in one-way ANOVA followed by Tukey tests for shoot and root, separately). c Volcano plot demonstrating contrasting gene expression profiles of tomato plants treated with salt stress alone (NaCl) or salt stress and DMSP (NaCl + DMSP). Each dot represents a gene, with red dots indicating genes that are more highly expressed in NaCl treatment, blue dots representing downregulation, and grey dots denoting genes that are not significantly differentially expressed. Dotted lines indicate significance thresholds from DESeq2 analysis. d Clustered heatmap of average normalised count numbers of differentially expressed genes of interest from panel c, showing that samples from Control and NaCl + DMSP-treated plants cluster together away from samples from NaCl-treated plants. e DMSP measurements of Nicotiana benthamiana leaves transformed with different S. anglica DMSP synthesis genes, showing that all three genes (MMT, SDC and DOX) are needed for high DMSP accumulation (n = 15 for negative control, MMT SDC, SDC DOX, and MMT SDC DOX, n = 5 for MMT, SDC, DOX). p-value indicates statistical significance after one-way ANOVA followed by Tukey test; n.s. denotes no statistically significant difference. f DMSP measurements of Arabidopsis thaliana over-expressing S. anglica MMT, SDC and DOX showing highly elevated accumulation in four independent transgenic lines (n = 3 × 18 plants). g Images of wildtype (WT, Col-0) and transgenic A. thaliana seedlings (Line 2) growing in the presence and absence of NaCl, demonstrating over-expression of S. anglica DMSP synthesis genes (MMT, SDC and DOX) convey tolerance to salt stress. Scale bar = 1 cm. h Fresh weight measurements of plants in (g), demonstrating biomass rescue is statistically significant (n = 6 × 9 plants, total 54 per condition). p-values indicate statistical significance after one-way ANOVA followed by Tukey test. Data represent mean ± one standard error. Source data are provided as a Source Data file.

